clear
clc
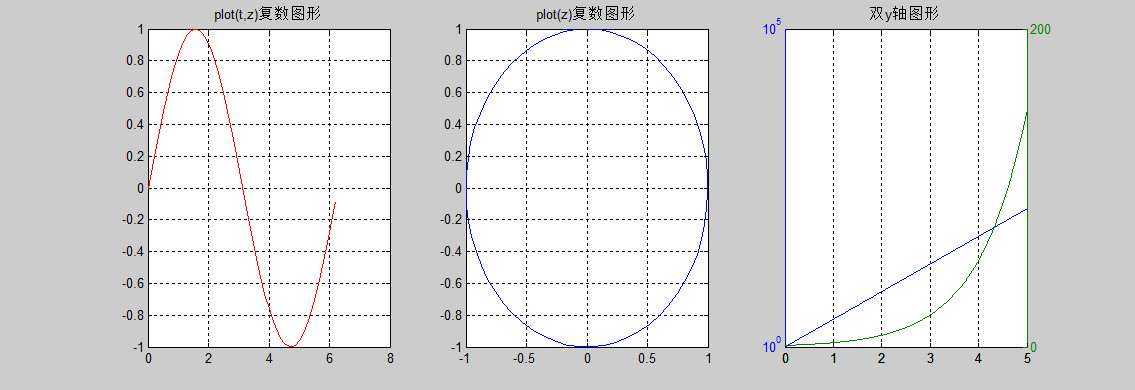
t=0:0.1:2*pi;
x=sin(t);
y=cos(t);
z=x+i*y;
subplot(1,3,1)
plot(t,z,'r') %注:这种方式下,不论参数t,z哪个是复数,都将忽略虚部数据,只绘制实部数据,其用法和绘制一般实数数据相同
title('plot(t,z)复数图形');
grid on
subplot(1,3,2)
plot(z,'b')
title('plot(z)复数图形');
grid on
x1=0:0.01:5;
y1=exp(x1);
subplot(1,3,3)
plotyy(x1,y1,x1,y1,'semilogy','plot')
title('双y轴图形');
grid on