1、MATLAB自编绘图函数
function [] = signal_write(X,w,flag)
% X:数据
% w:频率向量

 magX=abs(X);angX=angle(X);
 realX=real(X);imagX=imag(X);

if(flag == 1)
    figure();
    magX=abs(X);angX=angle(X);
    realX=real(X);imagX=imag(X);
    subplot(2,2,1);plot(w/pi,magX);grid
    xlabel('以pi为单位的频率');title('幅度部分');ylabel('幅度')
    subplot(2,2,3);plot(w/pi,angX);grid
    xlabel('以pi为单位的频率');title('相角部分');ylabel('弧度')
    subplot(2,2,2);plot(w/pi,realX);grid
    xlabel('以pi为单位的频率');title('实部');ylabel('实部')
    subplot(2,2,4);plot(w/pi,imagX);grid
    xlabel('以pi为单位的频率');title('虚部');ylabel('虚部')
end

if(flag == 2)
    plot(w/pi,magX);grid
    xlabel('以pi为单位的频率');title('幅度部分');ylabel('幅度')
end


if(flag == 3)
    plot(w/pi,angX);grid
    xlabel('以pi为单位的频率');title('相角部分');ylabel('弧度')
end

if(flag == 4)
    plot(w/pi,realX);grid
    xlabel('以pi为单位的频率');title('实部');ylabel('实部')
end

if(flag == 5)
    plot(w/pi,imagX);grid
    xlabel('以pi为单位的频率');title('虚部');ylabel('虚部')
end
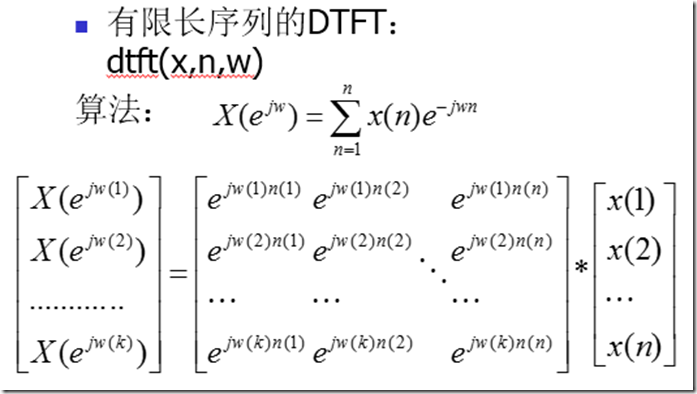
2、DTFT变换函数
function[X]=dtft(x,n,w,flag)

%计算离散时间付里叶变换
%[X]=dtft(x,n,w)
%X=在w频率点上的DTFT数组
%x=n点有限长度序列
%n=样本位置向量
%w=频率点位置向量

X = x * (exp(-j).^(n' * w));

if(flag == 1)
    signal_write(X,w,1);
end
3、采样代码
function [  ] = caiyang(Fs,N,jt,flag)
%UNTITLED3 此处显示有关此函数的摘要
%   此处显示详细说明
%   Dt  模拟时间间隔:在特定精度下信号为模拟的
%   t   模拟时刻序列
%   n   离散时间索引
%   Ts  采样周期
%   Fs  采样频率
%   xa  在特定精度下,由离散信号逼近模拟信号
%   jt  是否需要重构
%   flag  5  第五题
%         6  第六题

Dt=0.00005;             % 模拟时间间隔:在特定精度下信号为模拟的
Ts=1/Fs;                % 采样周期
n=-N:1:N;               % 离散时间索引
nTs=n*Ts;               % 序列时刻索引
t=-N*Ts:Dt:N*Ts;        % 模拟时刻序列

if flag == 5
   xa=exp(-1000*abs(t));       % 在特定精度下,由离散信号逼近模拟信号

   x1=exp(-1000*abs(nTs));     % Fs=5000 样本/s:x1为采样后的离散时间序列
end

if flag == 6
   xa=sin(1000*pi*t);       % 在特定精度下,由离散信号逼近模拟信号

   x1=sin(1000*pi*nTs);     % Fs=5000 样本/s:x1为采样后的离散时间序列

end

if flag == 7
    xa = sin(20*pi*t + pi/4);
    x1 = sin(20*pi*nTs + pi/4);
end


K  = 500;                      % 对pi进行K等分:相当于对单位园2pi进行1000等分
dk = pi/K;                     % pi 的等分步进索引
w  = 0 : dk : pi;              % 角度步进索引
X  = x1 * exp(-j* n'*w);       % 对x1序列做离散傅立叶变换
Xr = real(X);
w  = [-fliplr(w),w(2:end)];    % 定义w负半轴
Xr = [fliplr(Xr),Xr(2:end)];   % 由于实部偶对称,得到Xr的负半轴


if jt == 1
   figure();
   % 绘出xa
   subplot(3,1,1)
   plot(t*1000,xa);hold on
   % 绘出x(jw)
   stem(n*Ts*1000,x1,'r.'),hold off,title('时域波形')

   % 绘出以pi归一化的数字频率对应的频域实部波形
   subplot(3,1,2);plot(w/pi,Xr);title('频域波形')

   subplot(3,1,3)
   chonggou(x1,Fs,N);
end

if jt == 0
   figure();
   % 绘出xa
   subplot(2,1,1);
   plot(t*1000,xa);hold on
   % 绘出x(jw)
   stem(n*Ts*1000,x1,'r.'),hold off,title('时域波形')

   % 绘出以pi归一化的数字频率对应的频域实部波形
   subplot(2,1,2);plot(w/pi,Xr);title('频域波形')
end
4、重构代码
function [  ] = chonggou(x1,Fs,N)
%UNTITLED4 此处显示有关此函数的摘要
%   此处显示详细说明
%   x1 抽样序列
%   Fs 采样率
%   t  时间轴
%   Dt 离散间隔,模拟信号


Dt  = 0.00005;             % 模拟时间间隔:在特定精度下信号为模拟的
n   = -N:N;
nTs = n/Fs;
t   = -N/Fs:Dt:N/Fs;        % 模拟时刻序列
xa  = x1 * sinc(Fs*(ones(length(nTs),1) * t-nTs'*ones(1,length(t))));      % 内插重构

plot(t*1000,xa, 'k' ),hold on
stem(nTs*1000,x1, 'r.' ),hold off ,title('重构波形' )
axis([-N/Fs*1000,N/Fs*1000,min(x1),max(x1)]);

end
