1. Prometheus安装
下载地址:https://prometheus.io/download/
Prometheus基于Golang编写,编译后的软件包不依赖于任何第三方依赖。只需要下载对应平台的二进制包,解压并添加基本的配置即可正常启动Prometheus Server。
1.1. 安装Prometheus Server
下载安装包:
解压:
tar -zxvf prometheus-2.30.0.linux-amd64.tar.gz
$ ll
total 185544
drwxr-xr-x 2 hadoop hadoop        38 Sep 14 10:24 console_libraries
drwxr-xr-x 2 hadoop hadoop       173 Sep 14 10:24 consoles
-rw-r--r-- 1 hadoop hadoop     11357 Sep 14 10:24 LICENSE
-rw-r--r-- 1 hadoop hadoop      3646 Sep 14 10:24 NOTICE
-rwxr-xr-x 1 hadoop hadoop 100343878 Sep 14 09:52 prometheus
-rw-r--r-- 1 hadoop hadoop       934 Sep 14 10:24 prometheus.yml
-rwxr-xr-x 1 hadoop hadoop  89626644 Sep 14 09:55 promtool
修改配置文件prometheus.yml,添加PushGateway与Node Exporter的监控配置:
# A scrape configuration containing exactly one endpoint to scrape:
# Here it's Prometheus itself.
scrape_configs:
  # The job name is added as a label `job=<job_name>` to any timeseries scraped from this config.
  - job_name: "prometheus"

    # metrics_path defaults to '/metrics'
    # scheme defaults to 'http'.

    static_configs:
      - targets: ["10.0.3.197:9090"]

  # add PushGateway monitor config
  - job_name: 'pushgateway'
    static_configs:
    - targets: ["10.0.3.197:9091"]    #此节点为EMR主节点
      labels:
        instance: pushgateway

  # add Node Exporter monitor config
  - job_name: 'node exporter'
    static_configs:
- targets: ['10.0.3.197:9100','10.0.3.34:9100']  #分别为EMR主节点与从节点
prometheus.yml配置文件说明:
1. global配置块:控制Prometheus服务器的全局配置
a) scrape_interval:配置拉取数据的时间间隔,默认为1分钟
b) evaluation_interval:规则验证(Evaluate rules,例如生成alert)的时间间隔,默认为1分钟
2. rule_files配置块:规则配置文件
3. scrape_config 配置块:配置采集目标相关,prometheus监视的目标。Prometheus自身的运行信息可以通过HTTP访问,所以Prometheus可以监控自己的运行数据。
a) job_name:监控作业的名称
b) static_configs:表示静态目标配置,就是固定从某个target拉取数据
c) targets:指定监控的目标,其实就是从哪拉数据。Prometheus会从http://10.0.3.197:9090/metrics 上拉取数据。这个节点为EMR主节点。
Prometheus可以在运行中自动加载配置。启动时需添加:--web.enable-lifecycle
1.2. 安装Pushgateway
Prometheus在正常情况下是采用Pull的模式,从产生metric的作业或者exporter(例如专门监控主机的NodeExporter)拉取监控数据。但是我们要监控的是Flink on YARN作业,
想要让Prometheus自动发现作业的提交、结束以及自动拉取数据显然是比较困难的。
PushGateway就是一个中转组件,通过配置Flink on YARN作业将metric推到PushGateway,Prometheus再从PushGateway拉取即可。
下载 pushgateway:
tar -zxvf pushgateway-1.4.1.linux-amd64.tar.gz
内容很简单,只有一个二进制文件pushgateway:
$ ll
total 16844
-rw-r--r-- 1 hadoop hadoop    11357 May 28 14:37 LICENSE
-rw-r--r-- 1 hadoop hadoop      487 May 28 14:37 NOTICE
-rwxr-xr-x 1 hadoop hadoop 17231089 May 28 14:30 pushgateway
1.3. 安装Alertmanager
tar -zxvf alertmanager-0.23.0.linux-amd64.tar.gz
1.4. 安装Node Exporter
tar -zxvf node_exporter-1.2.2.linux-amd64.tar.gz
在Prometheus的架构设计中,Prometheus Server主要负责数据的收集、存储、并且对外提供数据查询支持。而实际的监控样本数据的收集则由Exporter完成。
因此,为了能够监控到某些东西,例如主机的CPU使用率,我们需要使用到Exporter。Prometheus周期性的从Exporter暴露的HTTP地址(通常是/metrics)拉取监控样本数据。
Exporter是一个相对开放的概念,其可以是一个独立运行的程序,独立于监控目标。也可以是直接内置在监控目标中。只要能够向Prometheus提供标准格式的监控样本数据即可。
为了能够采集到主机的指标如CPU、内存、磁盘等信息。我们可以使用Node Exporter。Node Exporter 同样采用Golang编写,并且不存在任何的第三方依赖。只需要下载,解压即可运行。
启动:./node_exporter
然后即可在实例9100端口访问到node export 获取的当前主机的所有监控数据。例如:
http://10.0.3.197:9100/metrics
# HELP node_disk_written_bytes_total The total number of bytes written successfully.
# TYPE node_disk_written_bytes_total counter
node_disk_written_bytes_total{device="xvda"} 1.163564544e+09
node_disk_written_bytes_total{device="xvdb"} 5.83238272e+10
…
1.4.1. 将Node Export 安装到所有节点
此步骤可以通过 bootstrap来完成。
aws s3 cp s3://tang-prometheus/packages/node_exporter-1.2.2.linux-amd64.tar.gz .

tar -zxvf node_exporter-1.2.2.linux-amd64.tar.gz

node_exporter-1.2.2.linux-amd64/node_exporter &
修改 Prometheus配置文件prometheus.yml,并添加以下配置(前面已添加):
# add Node Exporter monitor config
- job_name: 'node exporter'
  static_configs:
  - targets: ['10.0.3.197','10.0.3.34']  #分别为EMR主节点与从节点
1.4.2. 设置为开启自动启动
$ sudo vim /usr/lib/systemd/system/node_exporter.service
[Unit]
Description=node_export
Documentation=https://github.com/prometheus/node_exporter
After=network.target

[Service]
Type=simple
User=hadoop
ExecStart=/home/hadoop/prometheus/node_exporter-1.2.2.linux-amd64/node_exporter
Restart=on-failure

[Install]
WantedBy=multi-user.target
在所有机器上设置为开机启动:
sudo systemctl enable node_exporter.service
启动服务(所有节点):
sudo systemctl start node_exporter.service
2. 启动Prometheus Server、Pushgateway和Altertmanager
启动Prometheus Server:
nohup ./prometheus --config.file=prometheus.yml > ./prometheus.log 2>&1 &
启动Pushgateway:
nohup ./pushgateway --web.listen-address :9091 > ./pushgateway.log 2>&1 &
启动Alertmanager:
nohup ./alertmanager --config.file=alertmanager.yml > ./alertmanager.log 2>&1 &
查看web页面:http://10.0.3.197:9090/

可以看到各个服务都是UP状态。
3. PromQL介绍
Prometheus通过指标名称(metrics name)以及对应的一组标签(labelset)唯一定义一条时间序列。指标名称反映了监控样本的基本标识,而label则在这个基本特征上为采集到的数据提供了多种特征维度。用户可以基于这些特征维度过滤、聚合、统计从而产生新的计算后的一条时间序列。
PromQL是Prometheus内置的数据查询语言,其提供对时间序列数据丰富的查询、聚合以及逻辑运算能力的支持。并且被广泛应用在Prometheus的日常应用中,包括对数据查询、可视化、告警处理中。
3.1. 基本用法
3.1.1. 查询时间序列
当Prometheus通过Exporter采集到相应的监控指标样本数据后,我们就可以通过PromQL对监控样本数据进行查询。
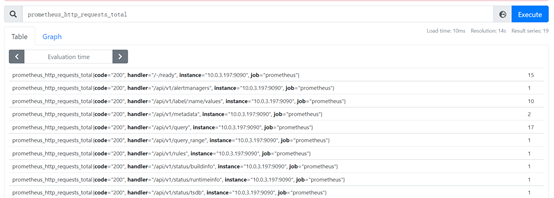
当我们直接使用监控指标名称查询时,可以查询该指标下的所有时间序列,例如:
prometheus_http_requests_total
其等同于:prometheus_http_requests_total{}
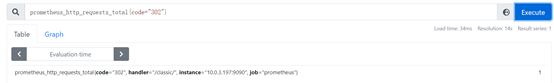
在花括号里可以加过滤条件,例如:prometheus_http_requests_total{code="302"}
PromQL还支持用户根据时间序列的标签匹配模式来对时间序列进行过滤,目前主要支持2种匹配模式:完全匹配和正则匹配。
PromQL支持使用 = 和 != 两种完全匹配模式:
- 通过使用label=value可以选择那些标签满足表达式定义的时间序列
- 反之使用label != value则可以根据标签匹配排除时间序列
例如,我们只需要查询所有prometheus_http_requests_total时间序列种满足标签instance为10.0.3.197:9090的时间序列:
prometheus_http_requests_total{instance="10.0.3.197:9090"}
反之使用:prometheus_http_requests_total{instance!="10.0.3.197:9090"}
PromQL还支持正则表达式作为匹配条件,多个表达式之间使用 | 进行分离:
- 使用label=~regx 表示选择那些标签符合正则表达式定义的时间序列
- 反之使用label!~regx进行排除
例如,如果想查询多个环节下的时间序列,可以使用如下表达式:
prometheus_http_requests_total{environment =~=~"staging|testing|development",method!="GET"}
排除用法:
prometheus_http_requests_total{environment !!~~"staging|testing|develop ment",method!="GET"}
3.1.2. 范围查询
直接通过类似于PromQL表达式httprequesttotal查询时间序列返回时,返回值中只会包含该时间序列中的最新的一个样本值,这样的返回结果我们称之为瞬时向量。而相应的这样的表达式称之为瞬时向量表达式。
而如果我们想查询过去一段时间范围内的样本数据时,需要使用区间向量表达式。区间向量表达式和瞬时向量表达式之间的差异在于:区间向量表达式中我们需要定义时间选择的范围,时间范围通过时间范围选择器[]进行定义。例如,通过以下表达式可以选择最近1分钟内的所有样本数据:
prometheus_http_requests_total{}[1m]
该表达式返回查询到的时间序列中最近1分钟的所有样本数据:
prometheus_http_requests_total{code="200", handler="/-/ready", instance="10.0.3.197:9090", job="prometheus"}
17 @1632465479.097
17 @1632465494.098
17 @1632465509.098
17 @1632465524.098

prometheus_http_requests_total{code="200", handler="/api/v1/alertmanagers", instance="10.0.3.197:9090", job="prometheus"}
1 @1632465479.097
1 @1632465494.098
1 @1632465509.098
1 @1632465524.098
通过区间向量表达式查询得到的结果称为区间向量。除了使用m表示分钟外,PromQL的时间范围选择器支持其他时间单位:
s – 秒
m – 分钟
h – 小时
d – 天
w – 周
y – 年
3.1.3. 时间位移操作
在瞬时向量表达式或者区间向量表达式中,都是以当前的时间为基准:
prometheus_http_requests_total{} # 瞬时向量表达式,选择当前最新的数据
prometheus_http_requests_total{}[1m] # 区间向量表达式,选择以当前时间为基准,1分钟内的数据
若是想查询1分钟前的瞬时样本数据,或者昨天一天的区间内的样本数据。此时可以使用位移操作,关键字为offset:
prometheus_http_requests_total{} offset 1m
prometheus_http_requests_total{}[1d] offset 1d
3.1.4. 使用聚合操作
一般来说,如果描述该样本特征的标签(label)并非唯一的情况下,通过PromQL查询数据时,会返回多条满足这些特征维度的时间序列。而PromQL提供的聚合操作可以用来对这些时间序列进行处理,形成一条新的时间序列:
# 查询系统所有 http 请求的总量
sum(prometheus_http_requests_total)
595

# 按照mode计算主机CPU的平均使用时间
avg(node_cpu_seconds_total) by (mode)
{mode="steal"}		1050.1375
{mode="system"}		12456.275
{mode="user"}		82099.76
{mode="idle"}		2683656.295
{mode="iowait"}		45.605
{mode="irq"}		0
{mode="nice"}		4.907500000000001
{mode="softirq"}	133.9325

# 按照主机查询各个主机的CPU使用率
sum( sum( irate(node_cpu_seconds_total{mode!='idle'}[5m]) ) / sum(irate(node_cpu_seconds_total[5m])) ) by (instance)
0.005614154474162029
3.1.5. 标量和字符串
除了使用瞬时向量表达式和区间向量表达式以外,PromQL还支持用户使用标量(Scalar)和字符串(String)。
1. 标量(Scalar):一个浮点型的数字值
标量只有一个数字,没有时序。例如:10
需要注意的是,当使用表达式count( prometheus_http_requests_total),返回的数据类型,依然是瞬时向量。用户可以通过内置函数scalar()将单个瞬时向量转换为标量。
count(prometheus_http_requests_total)
{}		22

scalar(count(prometheus_http_requests_total))
scalar	     22
2. 字符串(String):一个简单的字符串值
直接使用字符串,作为PromQL表达式,则会直接返回字符串。
"this is a string"
string	this is a string

'there are unescaped:
 \ 	'
string	there are unescaped:

`these are not unescaped: n ' " t`
string	these are not unescaped: n ' " t
3.1.6. 合法的PromQL表达式
所有的PromQL表达式都必须至少包含一个指标名称(例如http_request_total),或者一个不会匹配到空字符串的标签过滤器(例如{code=”200”})。
因此以下2种方式,均为合法的表达式:
prometheus_http_requests_total #合法
prometheus_http_requests_total{} #合法
如下表达式不合法:
{job=~".*"} # 不合法

Error executing query: invalid parameter "query": 1:1: parse error: vector selector must contain at least one non-empty matcher
同时,除了使用{label=value} 的形式外,还可以使用内置的 __name__ 标签来指定监控指标名称:
{__name__=~"prometheus_http_requests_total"} #合法
{__name__=~"node_disk_read_bytes_total|node_disk_written_bytes_total"} #合法
3.2. PromQL操作符
使用PromQL除了能够方便的按照查询和过滤时间序列外,PromQL还支持丰富的操作符,用户可以使用这些操作符,进一步对时间序列进行二次加工。这些操作符包括:数学运算符、逻辑运算符、布尔运算符等。
3.2.1. 数学运算
PromQL支持的所有数学运算符包括:+、-、*、/、%、^
3.2.2. 布尔运算
Prometheus支持的布尔运算符包括:==(相等)、!=(不相等)、>、<、>=、<=
使用bool修饰符改变布尔运算的行为
布尔运算符的默认行为是对时序数据进行过滤。而在其他的情况下我们可能需要的是真正的布尔结果。例如,只需要知道当前模块的HTTP请求量是否 >=1000,如果大于等于1000则返回1(true)否则返回0(false)。这是可以使用bool修饰符改变布尔运算的默认行为。例如:
# 过滤出所有>10 的结果
prometheus_http_requests_total > 10

prometheus_http_requests_total{code="200", handler="/-/ready", instance="10.0.3.197:9090", job="prometheus"}	17
prometheus_http_requests_total{code="200", handler="/api/v1/metadata", instance="10.0.3.197:9090", job="prometheus"}	13
prometheus_http_requests_total{code="200", handler="/api/v1/query", instance="10.0.3.197:9090", job="prometheus"}	70

# 返回所有结果,对每个结果进行比较
prometheus_http_requests_total > bool 10

{code="200", handler="/-/ready", instance="10.0.3.197:9090", job="prometheus"}	1
{code="200", handler="/api/v1/alertmanagers", instance="10.0.3.197:9090", job="prometheus"}	0
{code="200", handler="/api/v1/label/:name/values", instance="10.0.3.197:9090", job="prometheus"}	0
使用bool修饰符后,布尔运算不会对时间序列进行过滤,而是直接依次对瞬时向量种的各个样本数据与标量进行比较,得到结果0或1。从而形成一条新的时间序列。
同时需要注意的是,如果是在2个标量之间使用布尔运算,则必须使用bool修饰符:
2 == 2
Error executing query: invalid parameter "query": 1:3: parse error: comparisons between scalars must use BOOL modifier

2 == bool 2
scalar	1
3.2.3. 使用集合运算符
使用瞬时向量表达式能够获取到一个包含多个时间序列的集合,我们称为瞬时向量。通过集合运算,可以在2个瞬时向量之间进行相应的集合操作。
目前,Prometheus支持以下集合运算符:
l and(并且)
l or(或者)
l unless(排除)
vector1 and vector2 会产生一个由vector1的元素组成的新的向量。该向量包含vector1种完全匹配vector2种的元素组成。
vector1 or vector2 会产生一个新的向量,该向量包含vector1中所有的样本数据,以及vector2中没有与 vector1匹配到的样本数据。
vector1 unless vector2 会产生一个新的向量,新向量中的元素由vector1中没有与vector2匹配的元素组成。
3.2.4. 操作符优先级
对于复杂类型的表达式,需要了解运算操作的运行优先级。例如,查询主机的CPU使用率,可以使用表达式:
100 * (1 - avg(irate(node_cpu_seconds_total{mode='idle'}[5m])) by(job))
{job="node exporter"}	2.6666666660457805
其中irate是PromQL中的内置函数,用于计算区间向量中时间序列每秒的即时增长率。在PromQL操作符中优先级由高到低依次为:
l ^
l *, /, %
l +, -
l ==, !=, <=, =>
l and, unless
l or
3.2.5. PromQL聚合操作
Prometheus还提供了下列内置的聚合操作符,这些操作符作用于瞬时向量。可以将瞬时表达式返回的样本数据进行聚合,形成一个新的时间序列。
l sum
l min
l max
l avg
l stddev
l stdvar
l count
l count_values
l bottomk(后n条时序)
l topk
l quantile
使用聚合操作的语法如下:
aggr op>([parameter,] <vector expression>) [without|by (<label list>)]
其中只有count_values, quantile, topk, bottom 支持参数(parameter)。
without用于从计算结果中移除列举的标签,而保留其他标签。by 则正好相反,结果向量中只保留列出的标签,其余标签则移除。通过without和by可以按照样本的问题对数据进行聚合。
例如:
sum(prometheus_http_requests_total) without (instance)
等价于:
sum(prometheus_http_requests_total) by (code,handler,job,method)
count_values用于时间序列中每一个样本值出现的次数。count_values会为每一个唯一的样本值输出一个时间序列,并且每一个时间序列包含一个额外的标签。例如:
count_values("count", prometheus_http_requests_total)
{count="20"}	1
{count="102"}	1
{count="14"}	1
…
topk和bottomk则用于对样本值进行排序,返回当前样本值前n位,或者后n位的时间序列。
获取HTTP请求数前5的时序样本数据,可以使用表达式:
topk(3, prometheus_http_requests_total)

prometheus_http_requests_total{code="200", handler="/metrics", instance="10.0.3.197:9090", job="prometheus"}	679
prometheus_http_requests_total{code="200", handler="/api/v1/query", instance="10.0.3.197:9090", job="prometheus"}	103
prometheus_http_requests_total{code="200", handler="/classic/static/*filepath", instance="10.0.3.197:9090", job="prometheus"}	26
quantile用于计算当前样本数据值的分布情况quantile(φ, express) 其中 0≤φ≤1。
例如,当φ为0.5时,即表示找到当前样本数据中的中位数:
quantile(0.5, prometheus_http_requests_total)
{}	7
4. Prometheus与Flink集成
Flink提供的Metrics可以在Flink内部收集一些指标,通过这些指标,可以让开发者更好地理解作业或集群的状态。由于集群运行后很难发现内部的实际状况,例如是否执行缓慢、是否异常等。开发人员无法实时查看所有的Task日志。例如作业很大或者有很多作业的情况下,该如何处理?此时Metrics可以帮助开发人员了解作业的当前状况。
Flink官方支持了Prometheus,并且提供了对接Prometheus的jar包,集成起来很方便。
下载flink-metrics-prometheus.jar 包:
将此jar包拷贝到<flink_home>/lib 目录下:
sudo cp flink-metrics-prometheus_2.11-1.12.1.jar /usr/lib/flink/lib/
修改flink-conf.yaml文件,增加以下配置:
metrics.reporter.promgateway.class: org.apache.flink.metrics.prometheus.PrometheusPushGatewayReporter
# PushGateway conf
metrics.reporter.promgateway.host: 10.0.3.197
metrics.reporter.promgateway.port: 9091
# Flink metric label
metrics.reporter.promgateway.jobName: flink-metrics-test1
metrics.reporter.promgateway.randomJobNameSuffix: true
metrics.reporter.promgateway.deleteOnShutdown: false
metrics.reporter.promgateway.interval: 30 SECONDS
提交1个flink job:
flink run -c com.tang.wc.StreamWordCount -m yarn-cluster Flink.jar 10.0.3.197
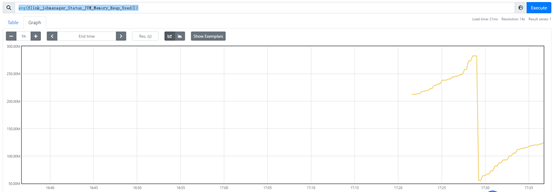
然后即可在 Prometheus中查询到Flink的各项指标,例如:flink_jobmanager_Status_JVM_Memory_Heap_Used