highcharts 图表结合angularjs 完成 请求数据动态显示图表。
一、我们要见将相关文件引入html中。
  <script type="text/javascript" src="/NEWPC/js/angular.min.js"></script>
   <script type="text/javascript" src="/NEWPC/js/jquery.min.js"></script>
   <script type="text/javascript" src="/NEWPC/js/highcharts.js"></script>
   <script type="text/javascript" src="/NEWPC/js/highcharts-ng.js"></script>
注意js引入的先后顺序
二、将图表以highchart DOM包含。
<highchart class="charts_div" config="chartConfig_interstate">
外层可以随意嵌套,样式要设置宽高,已经 block 属性
.charts_div{
    margin-top: 20px;
     490px;/*必须*/
    height: 200px;/*必须*/
    display: block;/*必须*/
}
三、将series 中的data 设置为$scope 的变量。
先自定义一组初始数据。
//图表数据
            $scope.chartData={
                interstate_series:{
                    data_download:[340,230,450,660,340,230],
                    data_upspeed:[660,340,230,340,230,450]
                },
                terminalstate_series:{
                    data:[
                            ['QH-20170829XYKT',45.0],
                            ['Firefox2',45.0],
                            ['Firefox3',45.0],
                        ]
                },
                cpustate_series:{
                    data:[20,78,54,65,22,21,36,64,99]
                },
                memorystate_series:{
                    data:[20,78,54,65,22,21,36,64,99]
                }
            };
初始数据一定要放在引用数据之前,否则会报错。
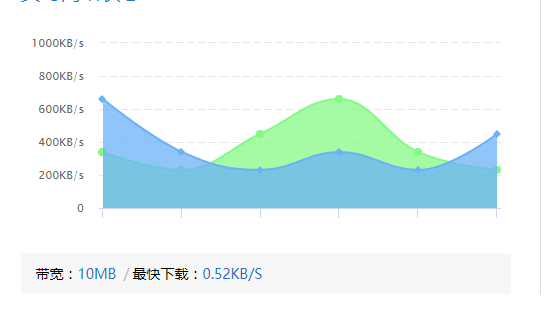
//网络速度 面积曲线图
            $scope.chartConfig_interstate={
                chart: {
                    type: 'areaspline'
                },
                title:{
                    text:null
                },
                xAxis: {
                    allowDecimals: false,
                    labels:false
                },
                legend:{//底部title禁止显示
                    enabled:false
                },
                yAxis: {
                    title: {
                        text: ''
                    },
                    gridLineDashStyle: 'longdash',//修改Y刻度线的样式类型为破折号
                    labels: {
                        formatter: function () {
                            if(this.value>1000){
                                return Math.round(this.value/1024)+"MB/s"
                            }else if(this.value<=1000&&this.value>0){
                                return this.value + "KB/s"
                            }else{
                                return "0"
                            };
                        }
                    },
                    tickPositioner: function () {
                        if(this.dataMax>=0&&this.dataMax<=1000){
                            var positions = [0,200,400,600,800,1000];
                        }else if (this.dataMax>1000&&this.dataMax<=5120) {
                            var positions = [0,1024,2048,3072,4096,5120];
                        }else if(this.dataMax>5120&&this.dataMax<=10240){
                            var positions = [0,2048,4096,6144,8192,10240];
                        }else if(this.dataMax>10240&&this.dataMax<=20480){
                            var positions = [0,4096,8192,12288,16384,10240];
                        }
                        return positions;
                    }
                },
                tooltip: {//鼠标移入显示数据
                    formatter: function () {
                        if (this.y>=1024) {
                            return this.series.name + Math.round((this.y/1024)*10)/10 +"MB/s"
                        }else{
                            return this.series.name + Math.round(this.y*10)/10 + "KB/s"
                        }
                    }
                },
                series: [{
                    name: '实时下载速度',
                    data:$scope.chartData.interstate_series.data_download,
                    color:'#85f985'//面积图的背景色
                },{
                    name: '实时上传速度',
                    data: $scope.chartData.interstate_series.data_upspeed,
                    color:'#6bb1f7'//面积图的背景色
                }]
            };
四、设置定时器,周期请求数据并更新数据。
//定期获取数据
            var setChartDate = setInterval(function(){
                $http({
                    method:'GET',
                    url:'wifi.php'
                }).then(function successCallback(response){
//                    console.log(response);
                    if(response){
                        console.log(response);
成功后将请求的数据赋值
                    }
                }, function errorCallback(){
                    console.log(2);
                });
            },1000);
这样就可以实时动态更新数据了