gnuplot是由Colin Kelly和Thomas Williams于1986年开始开发的科学绘图工具,支持二维和三维图形。它的功能是把数据资料和数学函数转换为容易观察的平面或立体的图形,它有两种工作方式,交互式方式和批处理方式,它可以让使用者很容易地读入外部的数据结果,在屏幕上显示图形,并且可以选择和修改图形的画法,明显地表现出数据的特性。
在做性能评测的时候,可能会使用到这个功能。这里通过分析一个例子来看。
从github上下载一个定时器源码
软件环境
安装好gnuplot工具:
sudo apt-get install gnuplot-qt- 1
- 1
命令分析
解压缩执行:
abel@ubuntu:~/Downloads/timeout-master$ make bench-all
mkdir -p bench
cc -o bench/bench-wheel.so ./bench/bench-wheel.c -I. -DWHEEL_BIT=6 -DWHEEL_NUM=4 -O2 -march=native -g -Wall -Wextra -Wno-unused-parameter -Wno-unused-function -fPIC -shared -lrt
mkdir -p bench
cc -o bench/bench.so ./bench/bench.c -I. -DWHEEL_BIT=6 -DWHEEL_NUM=4 -O2 -march=native -g -Wall -Wextra -Wno-unused-parameter -Wno-unused-function -fPIC -shared -lrt
cd bench
lua /home/abel/Downloads/timeout-master/bench/bench-add.lua /home/abel/Downloads/timeout-master/bench/bench-wheel.so
mv bench/wheel-add.dat.tmp bench/wheel-add.dat
cd bench
lua /home/abel/Downloads/timeout-master/bench/bench-del.lua /home/abel/Downloads/timeout-master/bench/bench-wheel.so
mv bench/wheel-del.dat.tmp bench/wheel-del.dat
cd bench
lua /home/abel/Downloads/timeout-master/bench/bench-expire.lua /home/abel/Downloads/timeout-master/bench/bench-wheel.so
mv bench/wheel-expire.dat.tmp bench/wheel-expire.dat
mkdir -p bench
cc -o bench/bench-heap.so ./bench/bench-heap.c -I. -DWHEEL_BIT=6 -DWHEEL_NUM=4 -O2 -march=native -g -Wall -Wextra -Wno-unused-parameter -Wno-unused-function -fPIC -shared -lrt
cd bench
lua /home/abel/Downloads/timeout-master/bench/bench-add.lua /home/abel/Downloads/timeout-master/bench/bench-heap.so
mv bench/heap-add.dat.tmp bench/heap-add.dat
cd bench
lua /home/abel/Downloads/timeout-master/bench/bench-del.lua /home/abel/Downloads/timeout-master/bench/bench-heap.so
mv bench/heap-del.dat.tmp bench/heap-del.dat
cd bench
lua /home/abel/Downloads/timeout-master/bench/bench-expire.lua /home/abel/Downloads/timeout-master/bench/bench-heap.so
mv bench/heap-expire.dat.tmp bench/heap-expire.dat
cd bench
gnuplot /home/abel/Downloads/timeout-master/bench/bench.plt
mv bench/bench.eps.tmp bench/bench.eps
ps2pdf /home/abel/Downloads/timeout-master/bench/bench.eps bench/bench.pdf
- 1
- 2
- 3
- 4
- 5
- 6
- 7
- 8
- 9
- 10
- 11
- 12
- 13
- 14
- 15
- 16
- 17
- 18
- 19
- 20
- 21
- 22
- 23
- 24
- 25
- 26
- 27
- 28
- 29
- 30
- 1
- 2
- 3
- 4
- 5
- 6
- 7
- 8
- 9
- 10
- 11
- 12
- 13
- 14
- 15
- 16
- 17
- 18
- 19
- 20
- 21
- 22
- 23
- 24
- 25
- 26
- 27
- 28
- 29
- 30
耐心点看完这个中间的流程。
1.在里面将会编译出来堆,时间轮两种实现的so文件
2.通过lua脚本分别运行add,del,expire产生结果数据放到
wheel-add.dat
wheel-del.dat
wheel-expire.dat
heap-add.dat
heap-del.dat
heap-expire.dat- 1
- 2
- 3
- 4
- 5
- 6
- 1
- 2
- 3
- 4
- 5
- 6
3.通过执行gnuplot生成报告
gnuplot /home/abel/Downloads/timeout-master/bench/bench.plt- 1
- 1
plt文件
重点就在于plt文件了
set terminal postscript color
set key top left
set xlabel "Number of timeouts"
set ylabel "Time
(microseconds)"
#set logscale x
set title "Time spent installing timeouts" font ",20"
plot 'heap-add.dat' using 1:($2*1000000) title "min-heap" with lines ls 1 lw 3 lc "red",
'wheel-add.dat' using 1:($2*1000000) title "hierarchical wheel" with lines ls 1 lw 3 lc "forest-green"
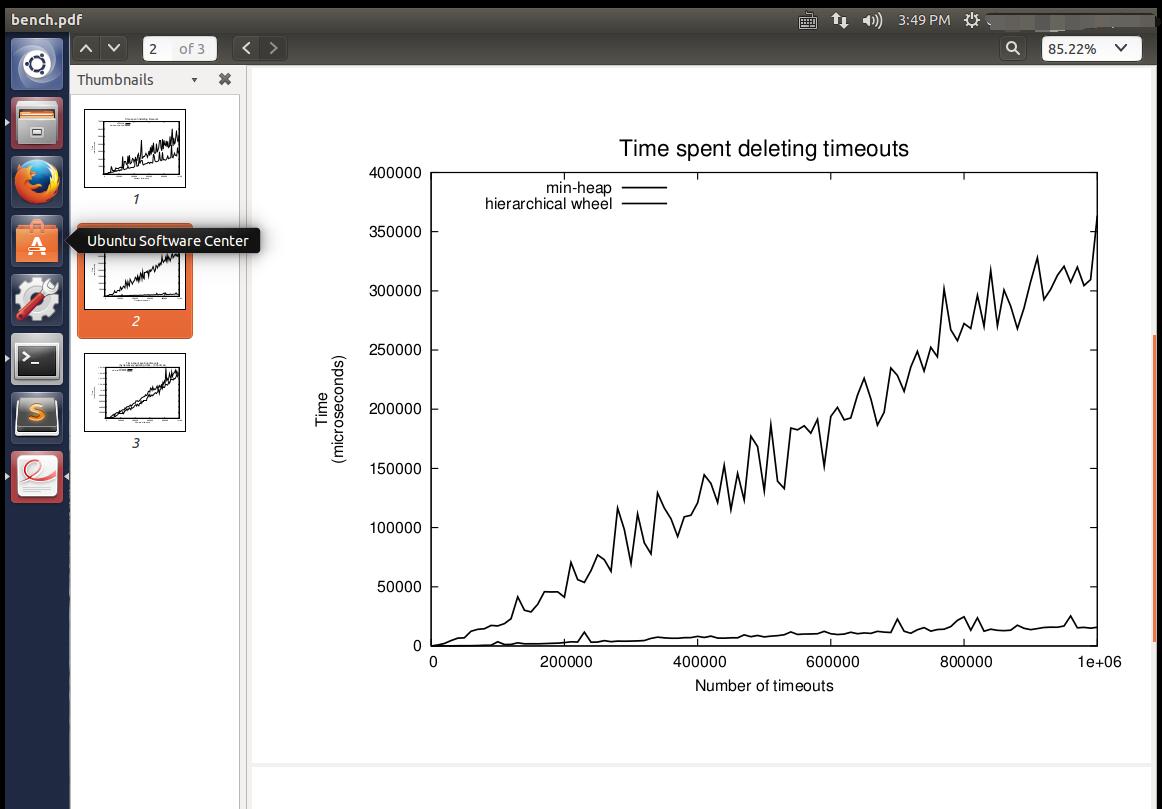
set title "Time spent deleting timeouts" font ",20"
plot 'heap-del.dat' using 1:($2*1000000) title "min-heap" with lines ls 1 lw 3 lc "red",
'wheel-del.dat' using 1:($2*1000000) title "hierarchical wheel" with lines ls 1 lw 3 lc "forest-green"
set title "Time spent expiring timeouts
(by iteratively updating clock ~1000 times)" font ",20"
plot 'heap-expire.dat' using 1:($2*1000000) title "min-heap" with lines ls 1 lw 3 lc "red",
'wheel-expire.dat' using 1:($2*1000000) title "hierarchical wheel" with lines ls 1 lw 3 lc "forest-green"- 1
- 2
- 3
- 4
- 5
- 6
- 7
- 8
- 9
- 10
- 11
- 12
- 13
- 14
- 15
- 16
- 17
- 18
- 1
- 2
- 3
- 4
- 5
- 6
- 7
- 8
- 9
- 10
- 11
- 12
- 13
- 14
- 15
- 16
- 17
- 18
这个文件说明了自己的plot读取的参数。title,字体,数据来源,等等参数。