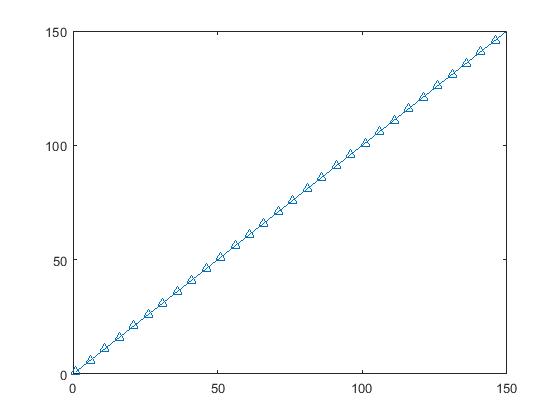
matlab plot函数画图间隔标记 x=1:1:150;y = 1:1:150;maker_idx = 1:5:150;plot(x,y,'-^','MarkerIndices',maker_idx)