例1、画出函数图像
>> x=-pi/2:0.01:pi/2;
>> y=x+sin(x)+exp(x);
>> plot(x,y,'r','Linewidth',2)

>> title('函数图像');
>> xlabel('x轴');
>> ylabel('y轴')
给图像添加注释:
title(‘y的函数图像’)
xlabel(‘x轴注释’)
ylabel(‘y轴的注释’)
legend(‘y=x+sin(x)+e^x’):图像示例
figure(n):表示第n个图像
一、数据可视化——plot函数
(1)plot指令的一般使用规范
plot(x,y):以x为横坐标,y为纵坐标,按照坐标(xj,yj)有序排列绘制图像
(2)plot(y):y为一维数组,以1:n为横坐标,yj为纵坐标,绘制图线,n为y的长度
(3)plot(z)
其中z为一维复数数组,实数代表横轴,虚数代表纵轴,在复平面上绘制(real(zj)),img(zj)的有序集合的图形。
(4)plot(A)
A为矩阵,绘制矩阵A的列对它下标的图形,矩阵A的行数表示横坐标,该行上的元素表示纵坐标,例如
>> A=[1,2,3;2,3,4;5,6,7]

A =

     1     2     3
     2     3     4
     5     6     7

>> plot(A)
>> plot(A,'o')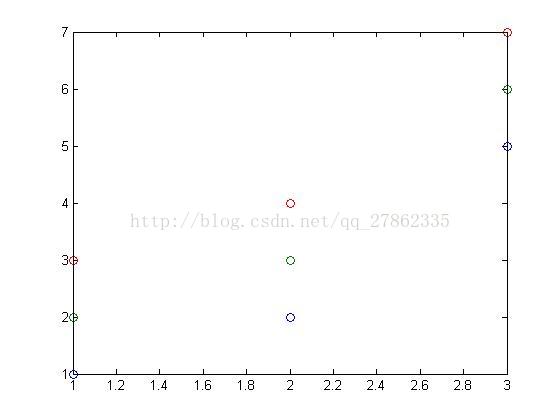
所绘制的曲线均采用颜色监视器上不同的颜色绘制而成。
(5)plot(x,A)
A位矩阵,绘制A对向量X的图形,对m*n的矩阵A和长度为m的向量x,绘制矩阵A的列对向量x的图形;如果x的长度为n,则绘制矩阵A的行向量x的图形,向量x可以是行向量,也可以是列向量。
(6)plot(A,x)
对矩阵A绘制向量x的图形。对于一个m*n的矩阵A和一个长度为m的向量x,对矩阵A的列绘制向量x的图形;如果x的长度为n,则对矩阵A 的行绘制向量x的图形。向量x可以是行向量,也可以是列向量
(7)plot(A,B)
A,B为矩阵,对矩阵A的行绘制矩阵B的列图形。如果A和B都是m*n的矩阵,则将会绘制h条由m个有序对炼成的曲线 ;
>> A

A =

     1     2     3
     2     3     4
     5     6     7

>> B

B =

     8     1     6
     3     5     7
     4     9     2

>> plot(A,B)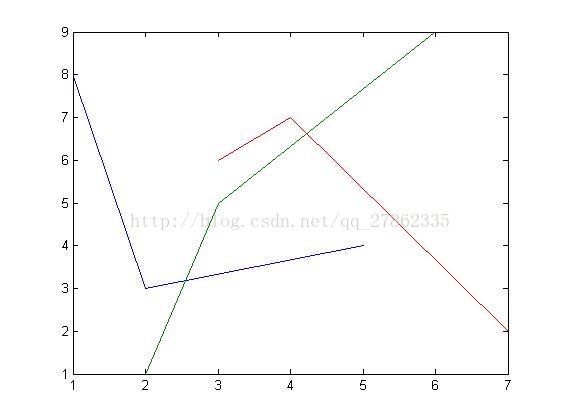
(8)plot(x,y,str):指定str的颜色和线型绘制图像
(9)plot(x1,y1,str,x2,y2,str2……)
二、添加格栅
grid函数对x,y轴增加格栅:grid on grid off
set(gca,‘xgrid’ ,‘on’):函数功能是在x轴加格栅
set:设置当前句柄的属性
on:打开
off:取消
ygrid:y轴的格栅
三、文字说明
①title(‘text’):在图形窗口顶端的中间位置输出字符串“text”作为标题
xlabel:
ylabel
zlabel:
②text(x,y,‘text’):在图形窗口中的(x,y)处写字符串“text”。坐标x,y按照所绘制的图形的刻度给出。如果x和y是相同维度的向量,‘text’也是一个字符串向量,“text i”将会输出在(xi ,yi)上
text(x,y,‘text’,‘sc’):左下角坐标为(0,0),右上角坐标为(1,1)。‘sc’表示将坐标抽归一化!
③:legend(str1,str2,str3,……,pos)
当前图像上输出图例,并说明字符串str1,str2等做标注。其中pos的可选项目如下,
pos取值:
-1 ====将图例框放在坐标轴外的右侧
0:====图窗内与曲线交叠最小的位置
1====右上角
2===左上角
3===左下角
4===右下角
legend(str1,str2,str3,……,'location',pos):功能同上,其中参数pos的可选项如下:
north===图内最上端
south===图内最下端
east===图内最右端
west===图内最左端
northeast===右上角
northwest===左上角
………………………………………………一共18种
legend off:从当前图形中清除图例
四、线型,颜色和标记
1、线型(5种)
-代表实现线
--代表虚线
-.点画线
:点线
none:无线
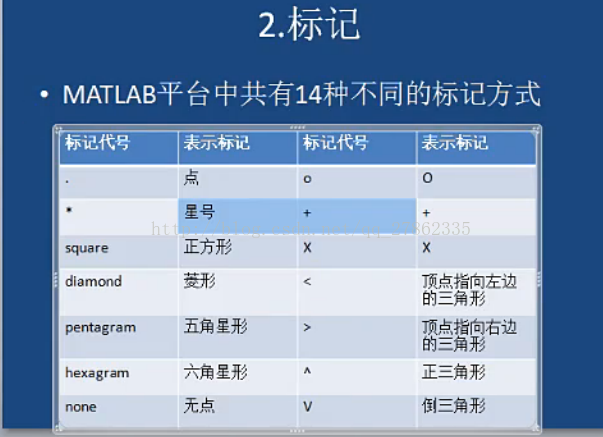
2、标记
3、颜色
matlab平台中有代号的颜色有8种
g:绿色
m:品红色
b:蓝色
c:灰色
w:白色
r:红色
k:黑色
y:黄色
五、坐标轴设置
matlab的坐标轴控制函数
axis auto:使用坐标轴的默认设置
axis ([xmin,xmax,ymin,ymax]):分别设置x,y轴的坐标范围
【注意:可以用xlim([xmin,xmax]),ylim([ymin,ymax])两个函数对想轴和y轴单独进行设置】
axis manual:保持当前坐标刻度范围
--------------------------------------------------------------------------------------------------------------
axis off:取消坐标轴标签,刻度及背景
axis on:打开坐标轴标签、刻度及背景
-------------------------------------------------------------------------------------------------------------
axis fill:在manual方式下,有效,是坐标充满整个绘图区,
axis equal:横,纵坐标采用等长刻度
axis image:横纵坐标采用等长刻度,且坐标框紧贴数据范围
axis tight:把数据范围直接设定为坐标轴范围
--------------------------------------------------------------------------------------------------------------
axis square:使用正方形坐标系
axis ij:使用矩阵坐标,远点在左上方
axis normal:使用默认矩阵坐标系,取消单位刻度的限制
axis xy:使用直角坐标系,原点在左下方
------------------------------------------------------------------------------------------------------------
坐标轴的设置可以通过set函数进行设置:
例如:
set(gca,'XGrid','on')设置x轴上的格栅
set(gca,‘XColor’,‘red’)设置x轴颜色
set(gca,'xlim',[xmin,xmax]):设置x轴的范围
>> plot(x,y)
>> text(pi,0,'nizai')
>> legend('y=sin(x)',-1)
>> legend('y=sin(x)',1)
>> legend('y=sin(x)',2)
>> legend('y=sin(x)',3)
>> legend('y=sin(x)',0)
>> legend('y=sin(x)','Location',north)
Undefined function or variable 'north'.

>> legend('y=sin(x)','Location','north')
>> plot(x,y,'-.')
>> x=0:0.1:8*pi;
>> y1=sin(x);
>> y2=2*sin(x/2);
>> y3
Undefined function or variable 'y3'.

>> y3=4*sin(x/4);
>> plot(x,y1,'r*--',x,y2,'gsquare',x,y3,'g--')
>> lengend(' y1=sin(x)','y2=2*sin(x/2)','y3=4*sin(x/4)')
Undefined function 'lengend' for input arguments of type 'char'.

>> legend(' y1=sin(x)','y2=2*sin(x/2)','y3=4*sin(x/4)')
>> legend(' y1=sin(x)','y2=2*sin(x/2)','y3=4*sin(x/4)',0)
>> axis off
>> axis on
>> axis ij
>> axis normal
>> axis auto
>> axis xy
>> set(gca,'xlim[-10,10]')
Error using hg.axes/set
The name 'xlim[-10,10]' is not an accessible property for an instance of class
'axes'.

>> set(gca,'xlim'[-10,10])
 set(gca,'xlim'[-10,10])
              |
Error: Unbalanced or unexpected parenthesis or bracket.

>> set(gca,'XColor','red')
>> set(gca,'XLim'[-10,10])
 set(gca,'XLim'[-10,10])
              |
Error: Unbalanced or unexpected parenthesis or bracket.

>> set(gca,'XLim[-10,10]')
Error using hg.axes/set
The name 'XLim[-10,10]' is not an accessible property for an instance of class
'axes'.

>> set(gca,'XLim([-10,10])')
Error using hg.axes/set
The name 'XLim([-10,10])' is not an accessible property for an instance of class
'axes'.

>> help(xlim)%help函数中的参数为字符串
Error using help (line 71)
Argument to help must be a string.

>> help(XLim)
Cannot find an exact (case-sensitive) match for 'XLim'

The closest match is: xlim
in D:MATLABR2012a	oolboxmatlabgraph3dxlim.m


>> help(xlim)
Error using help (line 71)
Argument to help must be a string.

>> help('xlim')
 xlim X limits.
    XL = xlim             gets the x limits of the current axes.
    xlim([XMIN XMAX])     sets the x limits.
    XLMODE = xlim('mode') gets the x limits mode.
    xlim(mode)            sets the x limits mode.
                             (mode can be 'auto' or 'manual')
    xlim(AX,...)          uses axes AX instead of current axes.

    xlim sets or gets the XLim or XLimMode property of an axes.

    See also pbaspect, daspect, ylim, zlim.

    Reference page in Help browser
       doc xlim

>> set(gca,'xlim'[-10,10])
 set(gca,'xlim'[-10,10])
              |
Error: Unbalanced or unexpected parenthesis or bracket.

>> set(gca,'xlim([-10,10])')
Error using hg.axes/set
The name 'xlim([-10,10])' is not an accessible property for an instance of class
'axes'.

>> set(gca,'xlim'([-10,10]))
 set(gca,'xlim'([-10,10]))
              |
Error: Unbalanced or unexpected parenthesis or bracket.

>> set(gca,'xlim',[-10,10])
>> set(gca,'xlim',[0,30])
>> set(gca,'xlim',[0,30])
六、图像叠绘
hold on 语句:语句功能为使当前轴及图形保留下来而不被刷新,并接受即将绘制的新的曲线
hold off:语句功能为不保留当前轴及图形,绘制新的曲线之后,原图被刷新。
hold语句:为hold on 和hold off 语句的切换