<!DOCTYPE html>
<html>
<head>
<meta name="viewport" content="width=device-width" />
<meta charset="utf-8">
<title>echars关系图</title>
<script src="https://cdn.bootcss.com/echarts/3.7.2/echarts.min.js"></script>
<style>
body, html, #main {
100%;
height: 100%;
}
</style>
</head>
<body>
<div id="main">
</div>
<script>
// 基于准备好的dom,初始化echarts实例
var myChart = echarts.init(document.getElementById('main'));
var option = {
tooltip: {
show: false
},
animationDurationUpdate: 1500,
animationEasingUpdate: 'quinticInOut',
series: [{
type: 'graph',
layout: 'none',
symbol: 'roundRect',
symbolSize: [120, 50],
symbolOffset: ['15%', 0],
roam: false, //禁止用鼠标滚轮缩小放大效果
edgeSymbol: ['circle', 'arrow'],
edgeSymbolSize: [4, 15],
//focusNodeAdjacency: true,
// 连接线上的文字
edgeLabel: {
normal: {
show: false,
textStyle: {
fontSize: 15
}
}
},
lineStyle: {
normal: {
opacity: 1,
2,
curveness: 0,//线条的曲度
}
},
itemStyle: {
normal: {
color: "#2d8cf0"
}
},
// 圆圈内的文字
label: {
normal: {
show: true,
textStyle: {
color: "#fff",
fontSize: 14,
}
}
},
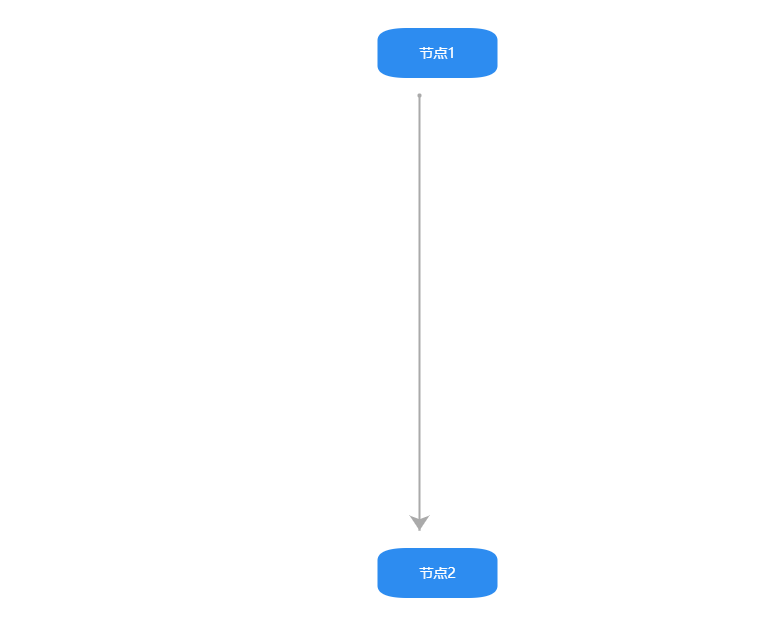
data: [{
name: '节点1',
x: 100,
y: 25,
}, {
name: '节点2',
x: 100,
y: 50,
}
],
// links: [],
links: [{
source: '节点1',
target: '节点2',
}]
}]
};
// 使用刚指定的配置项和数据显示图表。
myChart.setOption(option);
//单击事件 处理
myChart.on('click', function (params) {
if (params.dataType === "node") {
}
});
//窗口大小改变 关系图重置大小
window.onresize = myChart.resize;
</script>
</body>
</html>