首先我们要知道什么是Node_export?因为Prometheus本身不具备监控功能,我们要通过Prometheus收集数据,需要安装对应的export。如Node_export用于监控服务器状态,如cpu、内存、网络、磁盘等信息。
注意事项: node_exporter服务需要在两台机器都安装,这里我们以客户端(192.168.229.138)为例
客户端
1.创建运行用户
[root@localhost opt]# groupadd -r prometheus
[root@localhost opt]# useradd -r -g prometheus -d / -s /sbin/nologin -c "prometheus user" prometheus
2.下载安装
[root@localhost opt]# wget https://github.com/prometheus/node_exporter/releases/download/v0.18.1/node_exporter-0.18.1.linux-amd64.tar.gz
[root@localhost opt]# tar -xf node_exporter-0.18.1.linux-amd64.tar.gz
[root@localhost opt]# cp node_exporter-0.18.1.linux-amd64/node_exporter /usr/local/bin/
3.配置启动脚本
[root@localhost opt]# vim /usr/lib/systemd/system/node_exporter.service
[Unit]
Description=node_export
Documentation=https://github.com/prometheus/node_exporter
After=network.target

[Service]
Type=simple
User=prometheus
ExecStart=/usr/local/bin/node_exporter
Restart=on-failure
[Install]
WantedBy=multi-user.target
4.启动
[root@localhost opt]# systemctl daemon-reload
[root@localhost opt]# systemctl enable node_exporter
Created symlink from /etc/systemd/system/multi-user.target.wants/node_exporter.service to /usr/lib/systemd/system/node_exporter.service.
[root@localhost opt]# systemctl start node_exporter
5.监听9100端口
[root@localhost opt]# netstat -anlptu|grep 9100
tcp        0      0 192.168.229.139:56874   192.168.229.138:9100    ESTABLISHED 8528/prometheus
tcp        0      0 192.168.229.139:40074   192.168.229.139:9100    ESTABLISHED 8528/prometheus
tcp6       0      0 :::9100                 :::*                    LISTEN      6064/node_exporter
tcp6       0      0 192.168.229.139:9100    192.168.229.139:40074   ESTABLISHED 6064/node_exporter
服务端
1.安装node_exporter,参考客户端安装
2. 修改prometheus.yml
[root@localhost opt]# vim /etc/prometheus/prometheus.yml
scrape_configs:
  # The job name is added as a label `job=<job_name>` to any timeseries scraped from this config.
  - job_name: 'prometheus'
    # metrics_path defaults to '/metrics'
    # scheme defaults to 'http'.
    static_configs:
    - targets: ['localhost:9090']
  - job_name: 'node'   ### 新增加job
    static_configs:
    - targets: ['192.168.229.139:9100','192.168.229.138:9100']  ### 主机列表
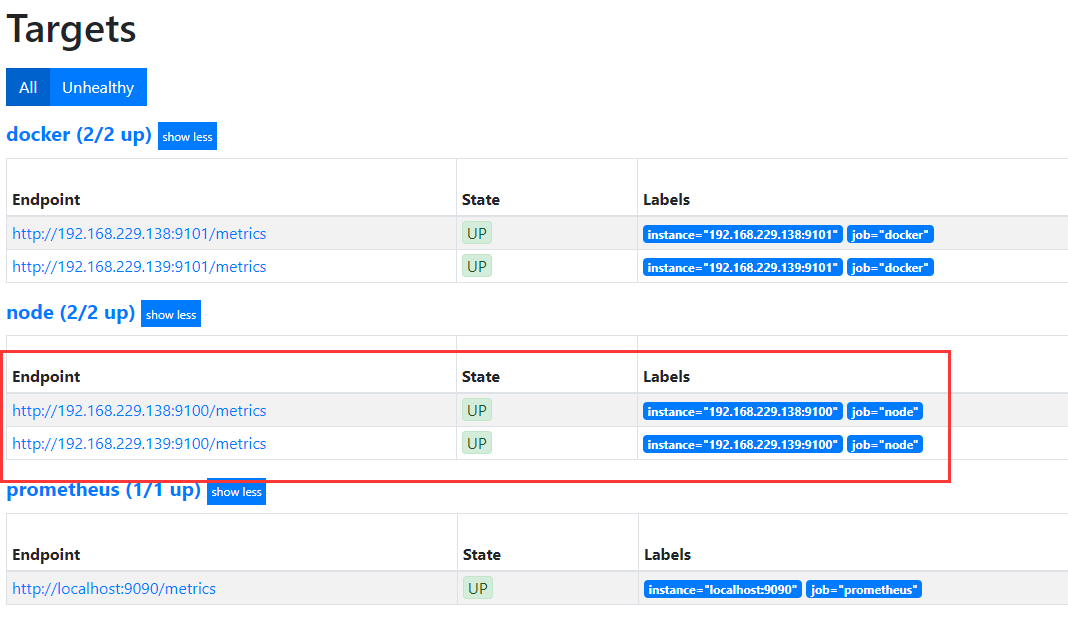
3.访问Prometheus Status > targets
4.收集系统CPU监控信息
4.1 CPU使用率
公式:100 - (avg by (instance) (irate(node_cpu_seconds_total{mode="idle"}[5m])) * 100)

4.2 CPU负载
公式:
1分钟负载:node_load1
5分钟负载:node_load5
15分钟负载:node_load15

5.收集系统内存监控信息
5.1 内存使用率
公式:(1 - (node_memory_MemAvailable_bytes / node_memory_MemTotal_bytes ))* 100
5.2 可用内存(单位:M)
公式:node_memory_MemAvailable_bytes / 1024 / 1024
6.收集系统磁盘监控信息
6.1 磁盘总大小(单位: G)
公式:node_filesystem_size_bytes {fstype=~"ext4|xfs"} / 1024 / 1024 / 1024
6.2 磁盘剩余大小(单位: G)
公式:node_filesystem_avail_bytes {fstype=~"ext4|xfs"} / 1024 / 1024 / 1024
6.3 磁盘使用率
公式:(1-(node_filesystem_free_bytes{fstype=~"ext4|xfs"} / node_filesystem_size_bytes{fstype=~"ext4|xfs"})) * 100
7.收集系统网络监控信息(ip add 查看网卡信息)
7.1 网卡入网流量 (指定某一个网卡)
公式:irate(node_network_receive_bytes_total{device='ens33'}[5m])
7.2 网卡出网流量(指定某一个网卡)
公式:irate(node_network_transmit_bytes_total{device='ens33'}[5m])
说明:以上收集系统各信息,都是通过node_exporter服务进行数据的收集,然后通过prometheus内置的PromQL语句进行组合查询,对于每一个公式,都可以在prometheus WEB界面测试查询。关于具体的PromQL语句以及公式中函数的使用参考:PromQL语句
欢迎关注微信公众号:软件测试汪。软件测试交流群:809111560
转载请注意出处,谢谢合作