ss -ti
https://www.man7.org/linux/man-pages/man8/ss.8.html
-i, --info
Show internal TCP information. Below fields may appear:ts show string "ts" if the timestamp option is set
sack show string "sack" if the sack option is set
ecn show string "ecn" if the explicit congestion
notification option is setecnseen
show string "ecnseen" if the saw ecn flag is found
in received packetsfastopen
show string "fastopen" if the fastopen option is
setcong_alg
the congestion algorithm name, the default
congestion algorithm is "cubic"wscale:<snd_wscale>:<rcv_wscale>
if window scale option is used, this field shows
the send scale factor and receive scale factorrto:<icsk_rto>
tcp re-transmission timeout value, the unit is
millisecondbackoff:<icsk_backoff>
used for exponential backoff re-transmission, the
actual re-transmission timeout value is icsk_rto <<
icsk_backoffrtt:<rtt>/<rttvar>
rtt is the average round trip time, rttvar is the
mean deviation of rtt, their units are millisecondato:<ato>
ack timeout, unit is millisecond, used for delay
ack modemss:<mss>
max segment sizecwnd:<cwnd>
congestion window sizepmtu:<pmtu>
path MTU valuessthresh:<ssthresh>
tcp congestion window slow start thresholdbytes_acked:<bytes_acked>
bytes ackedbytes_received:<bytes_received>
bytes receivedsegs_out:<segs_out>
segments sent outsegs_in:<segs_in>
segments receivedsend <send_bps>bps
egress bpslastsnd:<lastsnd>
how long time since the last packet sent, the unit
is millisecondlastrcv:<lastrcv>
how long time since the last packet received, the
unit is millisecondlastack:<lastack>
how long time since the last ack received, the unit
is millisecondpacing_rate <pacing_rate>bps/<max_pacing_rate>bps
the pacing rate and max pacing ratercv_space:<rcv_space>
a helper variable for TCP internal auto tuning
socket receive buffertcp-ulp-mptcp flags:[MmBbJjecv]
token:<rem_token(rem_id)/loc_token(loc_id)> seq:<sn>
sfseq:<ssn> ssnoff:<off> maplen:<maplen>
MPTCP subflow information
分别代表了平均值,与方差值。

平均偏差是反映各标志值与算术平均数之间的平均差异。平均偏差越大,表明各标志值与算术平均数的差异程度越大,该算术平均数的代表性就越小;平均偏差越小,表明各标志值与算术平均数的差异程度越小,该算术平均数的代表性就越大
ESTAB      0      0                        10.125.0.194:37512                                 74.125.24.188:hpvroom               users:(("chrome",pid=96350,fd=34)) timer:(keepalive,14sec,0) uid:1000 ino:34489819 sk:ffff95eebee5ec80 <->
         ts sack cubic wscale:8,7 rto:253 rtt:52.01/0.598 ato:40 mss:1092 rcvmss:1092 advmss:1448 cwnd:10 bytes_acked:1617 bytes_received:6181 segs_out:1167 segs_in:1120 send 1.7Mbps lastsnd:1157707 lastrcv:1157655 lastack:30758 pacing_rate 3.4Mbps rcv_rtt:85.375 rcv_space:29200
rrt rto 这些参数
RTO(Retransmission TimeOut)即重传超时时间。
TCP超时与重传中一个很最重要的部分是对一个给定连接的往返时间(RTT)的测量。由于网络流量的变化,
这个时间会相应地发生改变,TCP需要跟踪这些变化并动态调整超时时间RTO。
RFC2988中是这样描述RTO的:“The Transmission Control Protocol (TCP) uses a retransmission timer to ensure
data delivery in the absence of any feedback from the remote data receiver. The
duration of this timer is referred to as RTO (retransmission timeout).”RTT(Round Trip Time)由三部分组成:链路的传播时间(propagation delay)、末端系统的处理时间、
路由器缓存中的排队和处理时间(queuing delay)。
其中,前两个部分的值对于一个TCP连接相对固定,路由器缓存中的排队和处理时间会随着整个网络拥塞程度
的变化而变化。所以RTT的变化在一定程度上反应了网络的拥塞程度。平均偏差
平均偏差(mean deviation),简写为mdev。
It is the mean of the distances between each value and the mean. It gives us an idea of how spread
out from the center the set of values is.
Here's the formula.通过计算平均偏差,可以知道一组数据的波动情况。
在这里,平均偏差可以用来衡量RTT的抖动情况。
————————————————
版权声明:本文为CSDN博主「zhangskd」的原创文章,遵循CC 4.0 BY-SA版权协议,转载请附上原文出处链接及本声明。
原文链接:https://blog.csdn.net/zhangskd/article/details/7196707
比如,redis压测,一个阿里云redis 5.0 主从版, 10MBS带宽,1G内存
xxxx:~/redis-5.0.4$ redis-benchmark -h xxxx.redis.rds.aliyuncs.com -c 50 -n 100000 -q
PING_INLINE: 45045.04 requests per second
PING_BULK: 45207.96 requests per second
SET: 45745.65 requests per second
GET: 46860.36 requests per second
INCR: 45599.63 requests per second
LPUSH: 46168.05 requests per second
RPUSH: 45495.91 requests per second
LPOP: 47303.69 requests per second
RPOP: 46168.05 requests per second
SADD: 46317.74 requests per second
HSET: 44523.60 requests per second
SPOP: 46598.32 requests per second
LPUSH (needed to benchmark LRANGE): 45126.35 requests per second
LRANGE_100 (first 100 elements): 46663.56 requests per second
LRANGE_300 (first 300 elements): 45454.54 requests per second
LRANGE_500 (first 450 elements): 46511.62 requests per second
LRANGE_600 (first 600 elements): 45998.16 requests per second
MSET (10 keys): 45289.86 requests per second
sudo ss -tipe 命令查看,速度是挺快的, 28.8Mbps = 3.6MBps
users:(("redis-benchmark",29244,41)) uid:1000 ino:57548680 sk:ffff8801073c7100 <->
         sack cubic wscale:9,7 rto:204 rtt:4/2 ato:40 mss:1440 cwnd:10 send 28.8Mbps rcv_rtt:624 rcv_space:29358
ESTAB      42     0                                     172.18.8.130:54541                                 172.18.192.95:6379     users:(("redis-benchmark",29244,18)) uid:1000 ino:57548657 sk:ffff8800127fb800 <->
         sack cubic wscale:9,7 rto:204 rtt:4/2 ato:40 mss:1440 cwnd:10 send 28.8Mbps rcv_rtt:744 rcv_space:29358
ESTAB      42     0                                     172.18.8.130:54570                                 172.18.192.95:6379     users:(("redis-benchmark",29244,47)) uid:1000 ino:57548686 sk:ffff880036078000 <->
         sack cubic wscale:9,7 rto:204 rtt:4/2 ato:40 mss:1440 cwnd:10 send 28.8Mbps rcv_rtt:736 rcv_space:29358
ESTAB      42     0                                     172.18.8.130:54529                                 172.18.192.95:6379     users:(("redis-benchmark",29244,6)) uid:1000 ino:57548645 sk:ffff8800366daa00 <->
         sack cubic wscale:9,7 rto:204 rtt:4/2 ato:40 mss:1440 cwnd:10 send 28.8Mbps rcv_space:29200
ESTAB      42     0                                     172.18.8.130:54569                                 172.18.192.95:6379     users:(("redis-benchmark",29244,46)) uid:1000 ino:57548685 sk:ffff880036078e00 <->
         sack cubic wscale:9,7 rto:204 rtt:4/2 ato:40 mss:1440 cwnd:10 send 28.8Mbps rcv_space:29200
ESTAB      42     0                                     172.18.8.130:54560                                 172.18.192.95:6379     users:(("redis-benchmark",29244,37)) uid:1000 ino:57548676 sk:ffff880135aeb100 <->
         sack cubic wscale:9,7 rto:204 rtt:4/2 ato:40 mss:1440 cwnd:10 send 28.8Mbps rcv_rtt:744 rcv_space:29358
ESTAB      42     0                                     172.18.8.130:54565                                 172.18.192.95:6379     users:(("redis-benchmark",29244,42)) uid:1000 ino:57548681 sk:ffff8801073c4000 <->
         sack cubic wscale:9,7 rto:204 rtt:4/2 ato:40 mss:1440 cwnd:10 send 28.8Mbps rcv_rtt:728 rcv_space:29358
ESTAB      42     0                                     172.18.8.130:54554                                 172.18.192.95:6379     users:(("redis-benchmark",29244,31)) uid:1000 ino:57548670 sk:ffff8801073c6a00 <->
但是从后台看监控,带宽入口使用率只有22%。10MBps的私网带宽 * 22 % = 2.2MBps, 内存占用40MB,cpu 32% 后面发现阿里云redis出错 (redis ERR illegal address:)需要设置白名单,还有免密码登录才能正确连接。重新连接后发现 redis出口带宽100%了, 这是因为之前的白名单,还有密码限制,redis没有返回的,现在又返回了,返回流量增大所以有100%,21K*KBps的出口流量
xxxx.rds.aliyuncs.com:6379> keys *
1) "key:__rand_int__"
2) "mylist"
3) "counter:__rand_int__"
4) "myset:__rand_int__"
xxxx.redis.rds.aliyuncs.com:6379> info
# Server
redis_version:5.0.5
redis_git_sha1:01f59723
redis_git_dirty:1
redis_build_id:ccaf230a84093f60
redis_mode:standalone
os:Linux
arch_bits:64
multiplexing_api:epoll
atomicvar_api:atomic-builtin
gcc_version:0.0.0
process_id:48892
run_id:d8de2fc2dc480f8c0e3c4eea6621c5e52605ec25
tcp_port:6379
uptime_in_seconds:2846
uptime_in_days:0
hz:10
configured_hz:10
lru_clock:13009772
executable:
config_file:
support_ptod:1

# Clients
connected_clients:52
client_recent_max_input_buffer:4
client_recent_max_output_buffer:0
blocked_clients:0

# Memory
used_memory:43736280
used_memory_human:41.71M
used_memory_rss:26066944
used_memory_rss_human:24.86M
used_memory_peak:43800912
used_memory_peak_human:41.77M
used_memory_peak_perc:99.85%
used_memory_overhead:41249262
used_memory_startup:5001320
used_memory_dataset:2487018
used_memory_dataset_perc:6.42%
allocator_allocated:43985264
allocator_active:44830720
allocator_resident:55562240
used_memory_lua:37888
used_memory_lua_human:37.00K
used_memory_scripts:0
used_memory_scripts_human:0B
number_of_cached_scripts:0
maxmemory:1073741824
maxmemory_human:1.00G
maxmemory_policy:volatile-lru
allocator_frag_ratio:1.02
allocator_frag_bytes:845456
allocator_rss_ratio:1.24
allocator_rss_bytes:10731520
rss_overhead_ratio:0.47
rss_overhead_bytes:-29495296
mem_fragmentation_ratio:0.60
mem_fragmentation_bytes:-17684400
mem_not_counted_for_evict:2010
mem_replication_backlog:33554432
mem_clients_slaves:49814
mem_clients_normal:2641454
mem_aof_buffer:2010
mem_allocator:jemalloc-5.1.0
active_defrag_running:0
lazyfree_pending_objects:0
oom_err_count:0

# Stats
total_connections_received:240340
total_commands_processed:51413913
instantaneous_ops_per_sec:44728
instantaneous_write_ops_per_sec:32151
instantaneous_read_ops_per_sec:12577
total_net_input_bytes:2726550319
total_net_output_bytes:2434351341
instantaneous_input_kbps:1451.72
instantaneous_output_kbps:1487.63
rejected_connections:0
rejected_connections_status:0
sync_full:1
sync_partial_ok:0
sync_partial_err:0
expired_keys:0
expired_stale_perc:0.00
expired_time_cap_reached_count:0
evicted_keys:0
evicted_keys_per_sec:0
keyspace_hits:110000
keyspace_misses:0
hits_per_sec:6250
misses_per_sec:0
hit_rate_percentage:100.00
pubsub_channels:0
pubsub_patterns:0
latest_fork_usec:389
migrate_cached_sockets:0
slave_expires_tracked_keys:0
active_defrag_hits:0
active_defrag_misses:0
active_defrag_key_hits:0
active_defrag_key_misses:0
traffic_control_input:2200
traffic_control_input_status:0
traffic_control_output:555970
traffic_control_output_status:1
stat_avg_rt:2
stat_max_rt:760
pacluster_migrate_sum_rt:0
pacluster_migrate_max_rt:0
pacluster_migrate_qps:0
pacluster_import_sum_rt:0
pacluster_import_max_rt:0
pacluster_import_qps:0
pacluster_migrate_start_time:0
pacluster_importing_start_time:0
slot_psync_ok:0
slot_psync_err:0

# Replication
role:master

# CPU
used_cpu_sys:367.807143
used_cpu_user:219.860434
used_cpu_sys_children:0.000000
used_cpu_user_children:0.001337

# Cluster
cluster_enabled:0
databases:256
nodecount:1

# paCluster
pacluster_enabled:0

# Keyspace
db0:keys=4,expires=0,avg_ttl=0
xxxx:~$ redis-cli -h xxxx.redis.rds.aliyuncs.com --bigkeys

# Scanning the entire keyspace to find biggest keys as well as
# average sizes per key type. You can use -i 0.1 to sleep 0.1 sec
# per 100 SCAN commands (not usually needed).

[00.00%] Biggest string found so far 'counter:__rand_int__' with 6 bytes
[00.00%] Biggest hash found so far 'myset:__rand_int__' with 1 fields
[00.00%] Biggest list found so far 'mylist' with 490000 items

-------- summary -------

Sampled 4 keys in the keyspace!
Total key length in bytes is 60 (avg len 15.00)

Biggest list found 'mylist' has 490000 items
Biggest hash found 'myset:__rand_int__' has 1 fields
Biggest string found 'counter:__rand_int__' has 6 bytes

1 lists with 490000 items (25.00% of keys, avg size 490000.00)
1 hashs with 1 fields (25.00% of keys, avg size 1.00)
2 strings with 9 bytes (50.00% of keys, avg size 4.50)
0 streams with 0 entries (00.00% of keys, avg size 0.00)
0 sets with 0 members (00.00% of keys, avg size 0.00)
0 zsets with 0 members (00.00% of keys, avg size 0.00)
一个http 请求,需要经过哪些步骤, 其中耗时消耗在哪里?
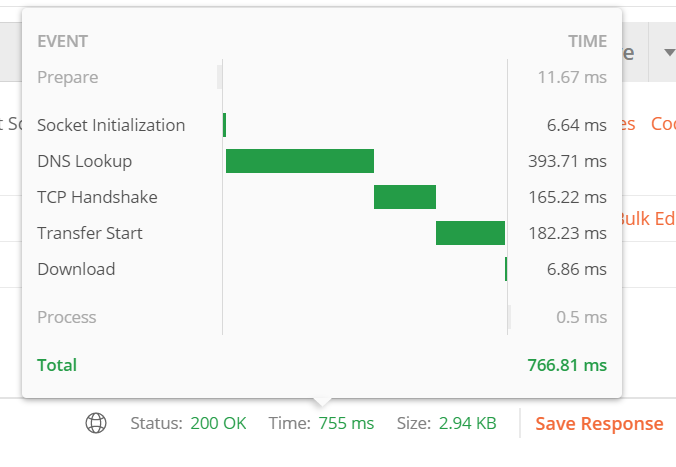
可以看出DNS这个耗时是挺大的,但是一旦请求一次有了DNS cache之后,这个速度就会加快很多。transfer time不是很明白,看网站回答说是:
https://stackoverflow.com/questions/66328322/what-does-transfer-start-mean-in-postman
so start time is the time required to get the first byte of the response and download time is the time taken to fetch the full data.
第二次请求
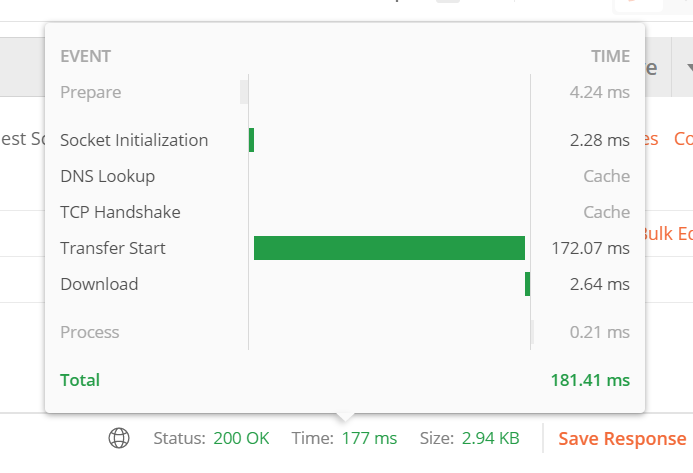
就是只剩下tranfer start 耗时占了大头了, download是传输时间,耗时挺小的。那还是程序响应得比较慢
但是看看服务端的接口日志, latency_human这个值很低啊, 所以还是网络的问题?(背景:服务器在国外)
{"time":"2021-06-13T17:57:06.627807625+08:00","id":"","remote_ip":"xxxxx","host":"xxxxxxx","method":"POST","uri":"xxxxx","user_agent":"PostmanRuntime/7.26.8","status":200,"error":"","latency":3704220,"latency_human":"3.70422ms","bytes_in":26,"bytes_out":2882}
后端是golang echo框架的,看echo服务器的源码是如何计算laterncy的, 发觉是框架内部中间件-日志记录,计算的是处理业务的函数的耗时
func LoggerWithConfig(config LoggerConfig) echo.MiddlewareFunc {
	// Defaults
	if config.Skipper == nil {
		config.Skipper = DefaultLoggerConfig.Skipper
	}
	if config.Format == "" {
		config.Format = DefaultLoggerConfig.Format
	}
	if config.Output == nil {
		config.Output = DefaultLoggerConfig.Output
	}

	config.template = fasttemplate.New(config.Format, "${", "}")
	config.colorer = color.New()
	config.colorer.SetOutput(config.Output)
	config.pool = &sync.Pool{
		New: func() interface{} {
			return bytes.NewBuffer(make([]byte, 256))
		},
	}

	return func(next echo.HandlerFunc) echo.HandlerFunc {
		return func(c echo.Context) (err error) {
			if config.Skipper(c) {
				return next(c)
			}

			req := c.Request()
			res := c.Response()
			start := time.Now()
			if err = next(c); err != nil {
				c.Error(err)
			}
			stop := time.Now()
			buf := config.pool.Get().(*bytes.Buffer)
			buf.Reset()
			defer config.pool.Put(buf)

			if _, err = config.template.ExecuteFunc(buf, func(w io.Writer, tag string) (int, error) {
				switch tag {
				case "time_unix":
					return buf.WriteString(strconv.FormatInt(time.Now().Unix(), 10))
				case "time_unix_nano":
					return buf.WriteString(strconv.FormatInt(time.Now().UnixNano(), 10))
				case "time_rfc3339":
					return buf.WriteString(time.Now().Format(time.RFC3339))
				case "time_rfc3339_nano":
					return buf.WriteString(time.Now().Format(time.RFC3339Nano))
				case "time_custom":
					return buf.WriteString(time.Now().Format(config.CustomTimeFormat))
				case "id":
					id := req.Header.Get(echo.HeaderXRequestID)
					if id == "" {
						id = res.Header().Get(echo.HeaderXRequestID)
					}
					return buf.WriteString(id)
				case "remote_ip":
					return buf.WriteString(c.RealIP())
				case "host":
					return buf.WriteString(req.Host)
				case "uri":
					return buf.WriteString(req.RequestURI)
				case "method":
					return buf.WriteString(req.Method)
				case "path":
					p := req.URL.Path
					if p == "" {
						p = "/"
					}
					return buf.WriteString(p)
				case "referer":
					return buf.WriteString(req.Referer())
				case "user_agent":
					return buf.WriteString(req.UserAgent())
				case "status":
					n := res.Status
					s := config.colorer.Green(n)
					switch {
					case n >= 500:
						s = config.colorer.Red(n)
					case n >= 400:
						s = config.colorer.Yellow(n)
					case n >= 300:
						s = config.colorer.Cyan(n)
					}
					return buf.WriteString(s)
				case "latency":
					l := stop.Sub(start)
					return buf.WriteString(strconv.FormatInt(int64(l), 10))
				case "latency_human":
					return buf.WriteString(stop.Sub(start).String())
				case "bytes_in":
					cl := req.Header.Get(echo.HeaderContentLength)
					if cl == "" {
						cl = "0"
					}
					return buf.WriteString(cl)
				case "bytes_out":
					return buf.WriteString(strconv.FormatInt(res.Size, 10))
				default:
					switch {
					case strings.HasPrefix(tag, "header:"):
						return buf.Write([]byte(c.Request().Header.Get(tag[7:])))
					case strings.HasPrefix(tag, "query:"):
						return buf.Write([]byte(c.QueryParam(tag[6:])))
					case strings.HasPrefix(tag, "form:"):
						return buf.Write([]byte(c.FormValue(tag[5:])))
					case strings.HasPrefix(tag, "cookie:"):
						cookie, err := c.Cookie(tag[7:])
						if err == nil {
							return buf.Write([]byte(cookie.Value))
						}
					}
				}
				return 0, nil
			}); err != nil {
				return
			}

			_, err = config.Output.Write(buf.Bytes())
			return
		}
	}
}
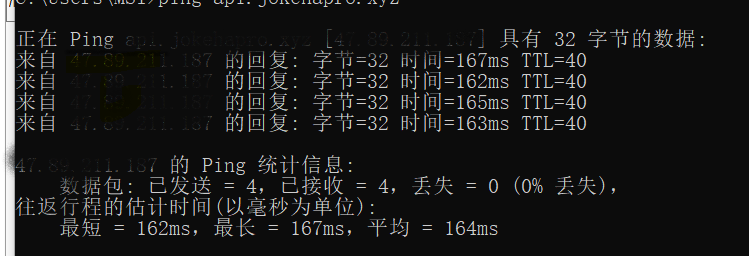
所以服务端日志说明耗时是挺小的,(背景:服务器在国外,业务量低,接近0),看来耗时在网络上, 可以ping一下网络延迟
生成一个文件curl-time.txt, 然后在curl 命令行调用是增加参数 curl -w "@curl-time.txt"
              http: %{http_code}

               dns: %{time_namelookup}s

          redirect: %{time_redirect}s

      time_connect: %{time_connect}s

   time_appconnect: %{time_appconnect}s

  time_pretransfer: %{time_pretransfer}s

time_starttransfer: %{time_starttransfer}s

     size_download: %{size_download}bytes

    speed_download: %{speed_download}B/s

                  ----------

        time_total: %{time_total}s
请求的结果有下面的显示
            http: 200
               dns: 0.013s
          redirect: 0.000s
      time_connect: 0.182s
   time_appconnect: 0.000s
  time_pretransfer: 0.182s
time_starttransfer: 0.355s
     size_download: 2882bytes
    speed_download: 8113.000B/s
                  ----------
        time_total: 0.355s
如果是本地请求,则快很多
        http: 200
               dns: 0.017556s
          redirect: 0.000000s
      time_connect: 0.017905s
   time_appconnect: 0.000000s
  time_pretransfer: 0.017935s
time_starttransfer: 0.021949s
     size_download: 2882bytes
    speed_download: 137238.000B/s
                  ----------
        time_total: 0.021992s
- time_namelookup :DNS 域名解析的时候
- time_connect :TCP 连接建立的时间,就是三次握手的时间
- time_appconnect :SSL/SSH 等上层协议建立连接的时间,比如 connect/handshake 的时间
- time_redirect :从开始到最后一个请求事务的时间
- time_pretransfer :从请求开始到响应开始传输的时间
- time_starttransfer :从请求开始到第一个字节将要传输的时间
- time_total :这次请求花费的全部时间
time_appconnect
The time, in seconds, it took from the start until the SSL/SSH/etc connect/handshake to the
remote host was completed. (Added in 7.19.0)time_connect The time, in seconds, it took from the start until the TCP connect to the remote host (or proxy)
was completed.time_namelookup
The time, in seconds, it took from the start until the name resolving was completed.time_pretransfer
The time, in seconds, it took from the start until the file transfer was just about to begin.
This includes all pre-transfer commands and negotiations that are specific to the particular pro‐
tocol(s) involved.time_redirect The time, in seconds, it took for all redirection steps include name lookup, connect, pretransfer
and transfer before the final transaction was started. time_redirect shows the complete execution
time for multiple redirections. (Added in 7.12.3)time_starttransfer
The time, in seconds, it took from the start until the first byte was just about to be trans‐
ferred. This includes time_pretransfer and also the time the server needed to calculate the result.
nginx 日志耗时字段含义
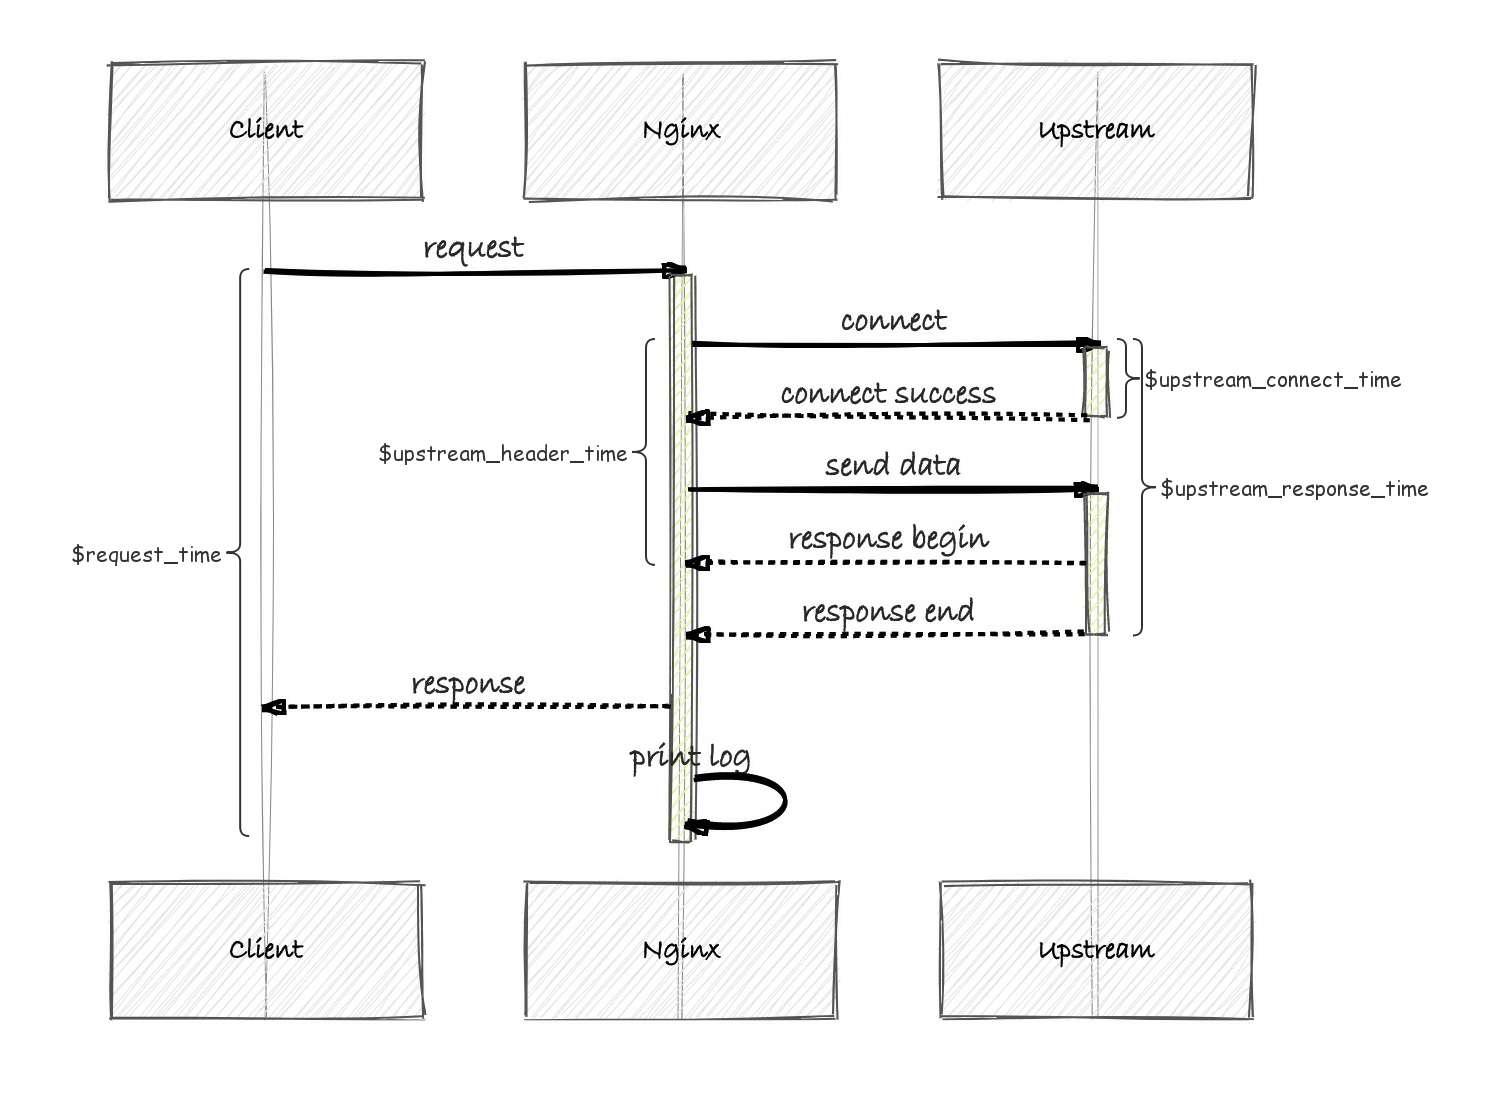
.