在讲解了 Hystrix Dashboard 之后,我们知道了,Hystrix Dashboard 实现的是单节点模式,一次只能监控一个服务,当有很多服务的时候,这样单节点模式去监控,就需要打开多个浏览器窗口,显然这是很麻烦的。这个时候,我们就可以用到 Spring Cloud 的另一个组件 Turbine,它可以聚合多个服务的 Hystrix Dashboard 的数据用以显示。
1、新建一个名称为spring-cloud-hystrix-dashboard-turbine的模块
2、build.gradle依赖
1 dependencies {
2     compile("org.springframework.cloud:spring-cloud-starter-netflix-turbine")
3     compile("org.springframework.cloud:spring-cloud-starter-netflix-hystrix-dashboard")
4 }
3、创建启动类
 1 /**
 2  * @author Leo
 3  */
 4 @SpringBootApplication
 5 @EnableHystrixDashboard
 6 @EnableTurbine
 7 public class HystrixDashboardTurbineApplication {
 8
 9     public static void main(String[] args) {
10
11         SpringApplication.run(HystrixDashboardTurbineApplication.class, args);
12     }
13 }
4、bootstrap.yml配置文件
 1 spring:
 2   application:
 3     name: spring-cloud-hystrix-dashboard-turbine
 4
 5 server:
 6   port: 8071
 7
 8 turbine:
 9   app-config: x-demo-service-feign,x-demo-service-ribbon
10   aggregator:
11     cluster-config: default
12   cluster-name-expression: "'default'"
13
14 eureka:
15   client:
16     service-url:
17       defaultZone: http://localhost:8761/eureka/
18
19 management:
20   endpoints:
21     web:
22       exposure:
23         include: '*'
24   endpoint:
25     health:
26       show-details: ALWAYS
5、依次启动eureka-server,x-demo-service,x-demo-service-feign,x-demo-service-ribbon,最后启动spring-cloud-hystrix-dashboard-turbine。
浏览器中输入:http://localhost:8071/hystrix
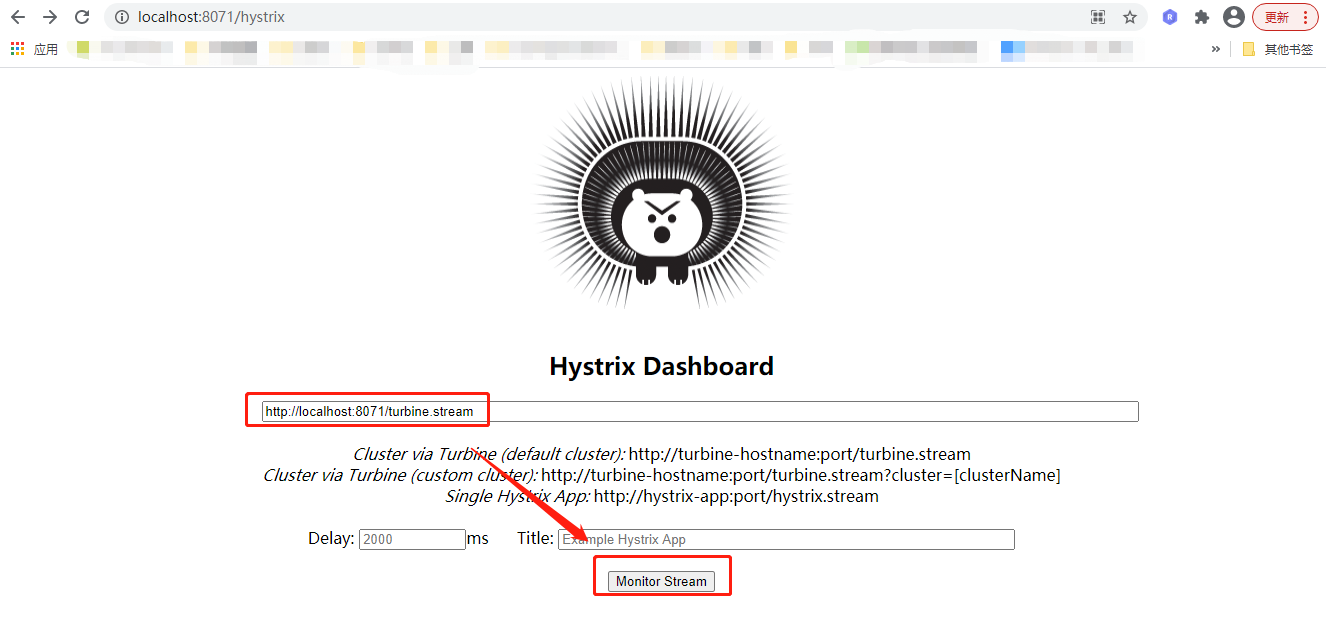
6、点击Monitor Stream查看监控信息
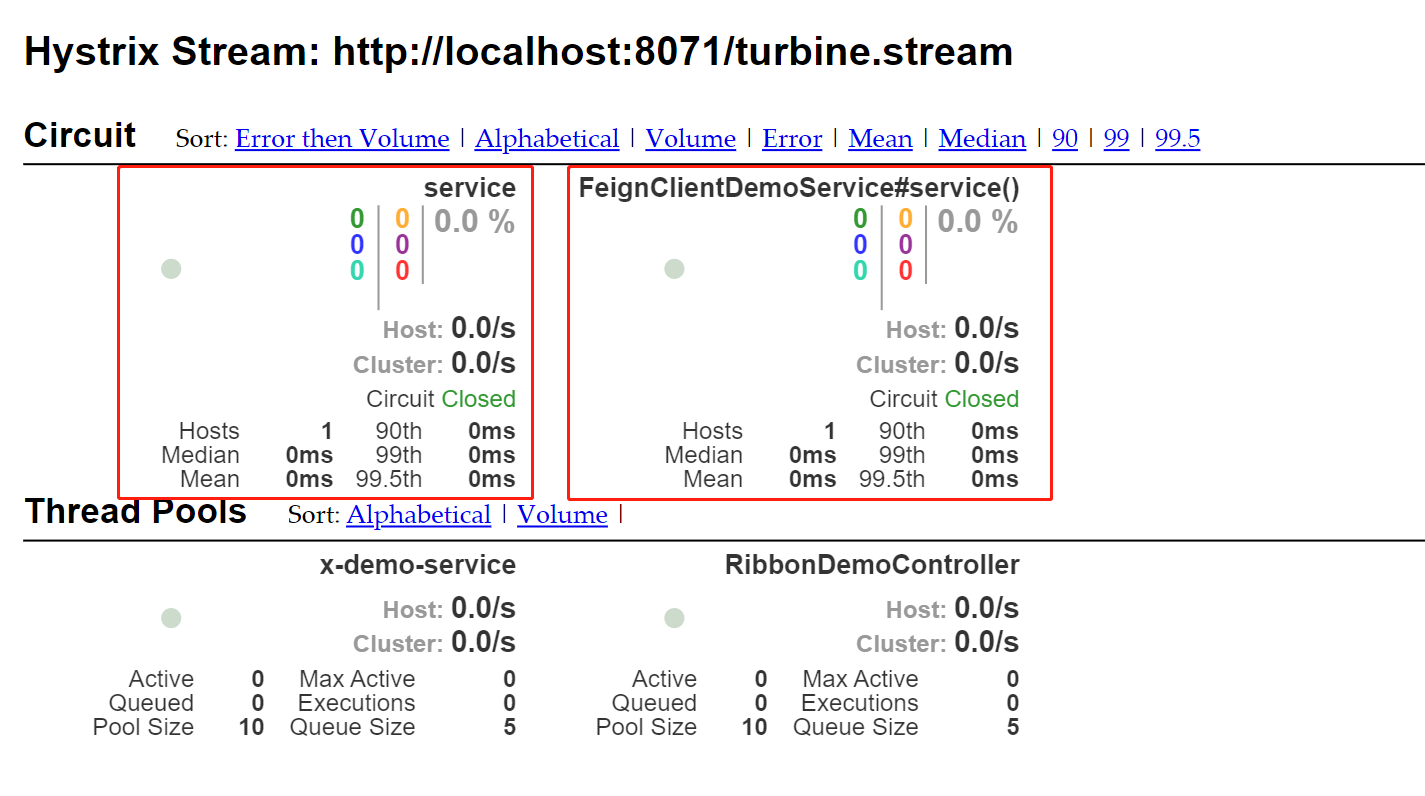
如上图,我们现在可以在一个监控页面看到多个服务的监控数据。