一、tomcat 可监控的内容
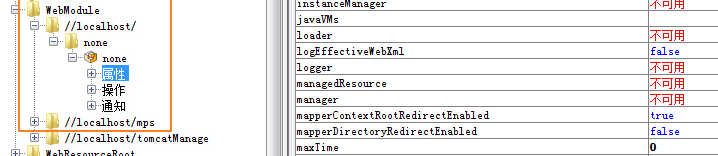
tomcat 通过 jmx 的形式对外提供 tomcat 的监控数据,比如:堆内存使用情况、线程使用情况等。一般通过 jdk 的工具 jconsole、jvisualvm 工具连接 在 tomcat 上开的 jmx 端口,可以界面化看到。监控数据项在 tomcat 本身是通过 Mbean 提供的,要想知道 tomcat 有哪些 Mbean,可以使用 jconsole 进行查看,该工具默认就有 Mbean 这个 tab。
| 监控项类别 | 监控项 | 说明 |
| Catalina:type=Connector,port=<端口> | URIEncoding | 编码方式,默认 UTF-8 |
| acceptCount | 可以建立的最大 tcp 连接数 | |
| address | ||
| ajpFlush | ||
| allowTrace | ||
| allowedRequestAttributesPattern | ||
| ciphers | ||
| ciphersUsed | ||
| className | ||
| connectionLinger | ||
| enableLookups | ||
| connectionTimeout | tcp 连接建立超时时间 | |
| executorName | ||
| keepAliveTimeout | 连接 keepalived 超时时间 | |
| localPort | tomcat 启动端口 | |
| maxHeaderCount | ||
| maxKeepAliveRequests | ||
| maxParameterCount | ||
| maxPostSize | ||
| maxSavePostSize | ||
| maxSwallowSize | ||
| maxThreads | 最大http并发请求数 | |
| minSpareThreads | 允许的最小http空闲请求线程数 | |
| modelerType | ||
| packetSize | ||
| port | ||
| processorCache | ||
| protocol | http 请求所使用的协议 | |
| protocolHandlerClassName | ||
| proxyName | ||
| proxyPort | ||
| redirectPort | 默认是 8443 | |
| scheme | 默认是 http | |
| secret | ||
| secretRequired | ||
| secure | ||
| sslProtocols | ||
| stateName | ||
| tcpNoDelay | ||
| threadPriority | ||
| useBodyEncodingForURI | ||
| useIPVHosts | ||
| xpoweredBy | ||
|
Catalina:type=GlobalRequestProcessor,name="http-nio-<端口>" 在代码中Mbean 获取时,可以配置 Catalina:type=GlobalRequestProcessor,name="*" |
bytesReceived | |
| bytesSent | ||
| errorCount | 从tomcat启动以来 ,其处理的请求失败的个数 | |
| maxTime | 从tomcat启动以来 ,处理的请求中耗时最长的时间 | |
| modelerType | ||
| processingTime | 从tomcat 启动以来,处理请求所耗费的总时长 | |
|
Catalina:type=Host,host=localhost (localhost的信息,一般是在server.xml 中 host (localhost)的静态配置信息) |
aliases | |
| appBase | war包所在父目录,默认为 webapps | |
| autoDeploy | boolean 值,是否自动加载 | |
| backgroundProcessorDelay | ||
| children | 部署在 appBase下的war包列表 | |
| configClass | ||
| contextClass | ||
| copyXML | ||
| createDirs | ||
| deployIgnore | ||
| deployXML | ||
| errorReportValveClass | ||
| modelerType | ||
| name | ||
| startChildren | ||
| startStopThreads | ||
| stateName | 运行状态 | |
| undeployOldVersions | ||
| unpackWARs | 布尔值,是否自动解压war包 | |
| valveNames | ||
| workDir | ||
| xmlBase | ||
| Catalina:type=ProtocolHandler,port=8080 | acceptCount | |
| acceptorThreadCount | ||
| acceptorThreadPriority | ||
| algorithm | ||
| allowHostHeaderMismatch | ||
| allowedTrailerHeaders | ||
| aprRequired | ||
| backlog | ||
| ciphers | ||
| clientAuth | ||
| clientCertProvider | ||
| compressableMimeType | ||
| compressableMimeTypes | ||
| compressibleMimeType | ||
| compressibleMimeTypes | ||
| compression | ||
| compressionMinSize | ||
| connectionCount | ||
| connectionLinger | ||
| connectionTimeout | ||
| connectionUploadTimeout | ||
| continueResponseTiming | ||
| crlFile | ||
| defaultSSLHostConfigName | ||
| disableUploadTimeout | ||
| domain | ||
| globalRequestProcessorMBeanName | ||
| keepAliveTimeout | ||
| keyAlias | ||
| keyPass | ||
| keystoreFile | ||
| keystorePass | ||
| keystoreProvider | ||
| keystoreType | ||
| localPort | ||
| maxConnections | ||
| maxExtensionSize | ||
| maxHeaderCount | ||
| maxHttpHeaderSize | ||
| maxKeepAliveRequests | ||
| maxSavePostSize | ||
| maxSwallowSize | ||
| maxThreads | ||
| maxTrailerSize | ||
| minSpareThreads | ||
| modelerType | ||
| name | ||
| nameIndex | ||
| noCompressionStrongETag | ||
| noCompressionUserAgents | ||
| objectName | ||
| pollerThreadCount | ||
| pollerThreadPriority | ||
| port | ||
| processorCache | ||
| rejectIllegalHeader | ||
| rejectIllegalHeaderName | ||
| relaxedPathChars | ||
| relaxedQueryChars | ||
| restrictedUserAgents | ||
| sSLCACertificateFile | ||
| sSLCACertificatePath | ||
| sSLCARevocationFile | ||
| sSLCARevocationPath | ||
| sSLCertificateChainFile | ||
| sSLCertificateFile | ||
| sSLCertificateKeyFile | ||
| sSLCipherSuite | ||
| sSLDisableCompression | ||
| sSLDisableSessionTickets | ||
| sSLEnabled | ||
| sSLHonorCipherOrder | ||
| sSLPassword | ||
| sSLProtocol | ||
| sSLVerifyClient | ||
| sSLVerifyDepth | ||
| secure | ||
| selectorTimeout | ||
| sendReasonPhrase | ||
| sendfileSupported | ||
| server | ||
| serverRemoveAppProvidedValues | ||
| sessionCacheSize | ||
| sessionTimeout | ||
| sniParseLimit | ||
| soLinger | ||
| soTimeout | ||
| sslEnabledProtocols | ||
| sslImplementationName | ||
| sslProtocol | ||
| tcpNoDelay | ||
| threadPriority | ||
| trustManagerClassName | ||
| trustMaxCertLength | ||
| truststoreAlgorithm | ||
| truststoreFile | ||
| truststorePass | ||
| truststoreProvider | ||
| truststoreType | ||
| useKeepAliveResponseHeader | ||
| useSendfile | ||
| useServerCipherSuitesOrder | ||
| waitingProcessorCount | ||
|
Catalina:type=Server (tomcat 本身信息) |
address | |
| serverBuilt | tomcat 被编译的版本 | |
| serverInfo | tomcat 名称 | |
| serverNumber | ||
| serviceNames | ||
| shutdown | ||
| stateName | 运行状态 | |
| Catalina:type=SocketProperties,name="http-nio-<端口>" | appReadBufSize | |
| appWriteBufSize | ||
| bufferPool | ||
| bufferPoolSize | ||
| directBuffer | ||
| directBufferPool | ||
| directSslBuffer | ||
| eventCache | ||
| processorCache | ||
| soLingerOn | ||
| soLingerTime | ||
| soTimeout | ||
| tcpNoDelay | ||
| timeoutInterval | ||
| unlockTimeout | ||
| Catalina:type=StringCache | accessCount | |
| byteEnabled | ||
| cacheSize | ||
| charEnabled | ||
| hitCount | ||
| trainThreshold | ||
|
Catalina:type=ThreadPool,name="http-nio-<端口>" (Catalina:type=ThreadPool,name=*) |
acceptCount | |
| acceptorThreadCount | ||
| acceptorThreadPriority | ||
| alpnSupported | ||
| bindOnInit | ||
| connectionCount | 连接数 | |
| connectionLinger | ||
| connectionTimeout | 连接超时时间 | |
| currentThreadCount | 当前线程池中总共可用线程数 | |
| currentThreadsBusy | 当前并发正在处理的请求数 | |
| daemon | 默认 true | |
| executorTerminationTimeoutMillis | ||
| keepAliveCount | ||
| keepAliveTimeout | ||
| localPort | ||
| maxConnections | 最大连接数 | |
| maxKeepAliveRequests | ||
| maxThreads | 最大可并发处理的请求数 | |
| minSpareThreads | ||
| pollerThreadCount | ||
| pollerThreadPriority | ||
| port | tomcat 启动端口 | |
| running | ||
| sSLEnabled | ||
| selectorTimeout | ||
| sniParseLimit | ||
| sslImplementation | ||
| sslImplementationName | ||
| tcpNoDelay | ||
| threadPriority | ||
| useInheritedChannel | ||
| useSendfile | ||
| java.lang:name=G1 Old Generation,type=GarbageCollector | CollectionCount | 从 tomcat 启动到目前为止,垃圾回收的次数 |
| CollectionTime | 从 tomcat 启动到目前为止,垃圾回收总共耗时时间 | |
| LastGcInfo | ||
| MemoryPoolNames | ||
| Name | ||
| Valid | ||
| java.lang:name=G1 Young Generation,type=GarbageCollector | 监控项同 “java.lang:name=G1 Old Generation,type=GarbageCollector” | |
| java.lang:type=Memory | HeapMemoryUsage | 堆内存使用情况 |
| NonHeapMemoryUsage | 非内存使用情况 | |
| java.lang:type=MemoryPool,name=CodeHeap 'non-nmethods' | PeakUsage | |
| Usage | ||
| UsageThreshold | ||
| UsageThresholdCount | ||
| UsageThresholdExceeded | ||
| UsageThresholdSupported | ||
| Type | NON_HEAP : 非堆 | |
| java.lang:type=MemoryPool,name=CodeHeap 'non-profiled nmethods' | 同 “java.lang:type=MemoryPool,name=CodeHeap 'non-nmethods'” | |
| java.lang:type=MemoryPool,name=CodeHeap 'profiled nmethods' | 同 “java.lang:type=MemoryPool,name=CodeHeap 'non-nmethods'” | |
| java.lang:type=MemoryPool,name=Compressed Class Space | 同 “java.lang:type=MemoryPool,name=CodeHeap 'non-nmethods'” | |
| java.lang:type=MemoryPool,name=G1 Eden Space | CollectionUsage | |
| CollectionUsageThreshold | ||
| CollectionUsageThresholdCount | ||
| CollectionUsageThresholdExceeded | ||
| CollectionUsageThresholdSupported | ||
| PeakUsage | ||
| Usage | ||
| Type | HEAP:堆 | |
| UsageThresholdSupported | ||
| java.lang:type=MemoryPool,name=G1 Old Gen | CollectionUsage | |
| CollectionUsageThreshold | ||
| CollectionUsageThresholdCount | ||
| CollectionUsageThresholdExceeded | ||
| CollectionUsageThresholdSupported | ||
| PeakUsage | ||
| Usage | ||
| Type | HEAP:堆 | |
| UsageThreshold | ||
| UsageThresholdCount | ||
| UsageThresholdExceeded | ||
| UsageThresholdSupported | ||
| java.lang:type=MemoryPool,name=G1 Survivor Space | 同 “java.lang:type=MemoryPool,name=G1 Eden Space” | |
| java.lang:type=MemoryPool,name=Metaspace | 同 “java.lang:type=MemoryPool,name=CodeHeap 'non-nmethods'” | |
| java.lang:type=OperatingSystem | Arch | |
| AvailableProcessors | 系统中 CPU 核数 | |
| CommittedVirtualMemorySize | ||
| FreePhysicalMemorySize | ||
| FreeSwapSpaceSize | ||
| MaxFileDescriptorCount | ||
| Name | 操作系统名称 | |
| OpenFileDescriptorCount | ||
| ProcessCpuLoad | ||
| ProcessCpuTime | ||
| SystemCpuLoad | ||
| SystemLoadAverage | ||
| TotalPhysicalMemorySize | ||
| TotalSwapSpaceSize | ||
| Version | 操作系统版本 | |
| java.lang:type=Runtime | BootClassPathSupported | |
| ClassPath | tomcat 运行时的 classpath | |
| InputArguments | 设置给 tomcat 的 jvm 参数 | |
| LibraryPath | ||
| ManagementSpecVersion | ||
| Name | PID + 系统的 hostname | |
| Pid | tomcat 进程号 | |
| SpecName | 如:Java Virtual Machine Specification | |
| SpecVendor | 如:Oracle Corporation | |
| SpecVersion | 如:11 | |
| StartTime | tomcat 启动时间,单位 毫秒 | |
| SystemProperties | ||
| Uptime | tomcat 持续运行时间,单位毫秒 | |
| VmName | 如:OpenJDK 64-Bit Server VM | |
| VmVendor | 如:Oracle Corporation | |
| VmVersion | 如:11.0.5+10-LTS | |
| java.lang:type=Threading | AllThreadIds | 活动的线程Id ,是一个 long 类型的数组 |
| CurrentThreadCpuTime | ||
| CurrentThreadCpuTimeSupported | ||
| CurrentThreadUserTime | ||
| DaemonThreadCount | 守护线程数 | |
| ObjectMonitorUsageSupported | ||
| PeakThreadCount | 实时峰值 | |
| SynchronizerUsageSupported | ||
| ThreadAllocatedMemoryEnabled | ||
| ThreadAllocatedMemorySupported | ||
| ThreadContentionMonitoringEnabled | ||
| ThreadContentionMonitoringSupported | ||
| ThreadCount | 活动的线程数 | |
| ThreadCpuTimeEnabled | ||
| ThreadCpuTimeSupported | ||
| TotalStartedThreadCount | 已启动的总数 | |
| java.nio:name=direct,type=BufferPool | Count | |
| MemoryUsed | ||
| TotalCapacity | ||
| java.nio:name=mapped,type=BufferPool | Count | |
| MemoryUsed | ||
| TotalCapacity | ||
| java.lang:type=ClassLoading | LoadedClassCount | 已载入类数 |
| TotalLoadedClassCount | 总共载入的类数量 | |
| UnloadedClassCount | 已卸载的类数量 | |
这个是各个 webapp 应用可监控的指标。
二、开启 tomcat jmx 监控
1、在 tomcat jvm 参数中配置 jmx 参数
1) 查看 tomcat 的启动脚本,阅读脚本内容,查看该脚本中设置jvm参数是哪里,在其中加上 jmx 参数:
-Dcom.sun.management.jmxremote

-Djava.rmi.server.hostname=192.168.23.1

-Dcom.sun.management.jmxremote.port=9999

-Dcom.sun.management.jmxremote.ssl=false

-Dcom.sun.management.jmxremote.authenticate=false
其中:
hostname 是你要查看的远程服务器的真实IP
port 是远程服务上 tomcat 要开启的 jmx 端口,这个端口只要选择服务器上没有被占用的端口即可。
一般上述内容加入: 进入Tomcat/bin目录,修改catalina.sh,找到如下内容 “#—–Execute The Requested Command”
2) 重启 tomcat
3) 使用 ps -ef|grep tomcat 查下 tomcat 进程,看下现在其启动参数中 jvm 参数里是否有 这个 jmx 参数

上述图中可以看出 jvm 参数中成功加入 jmx 参数。
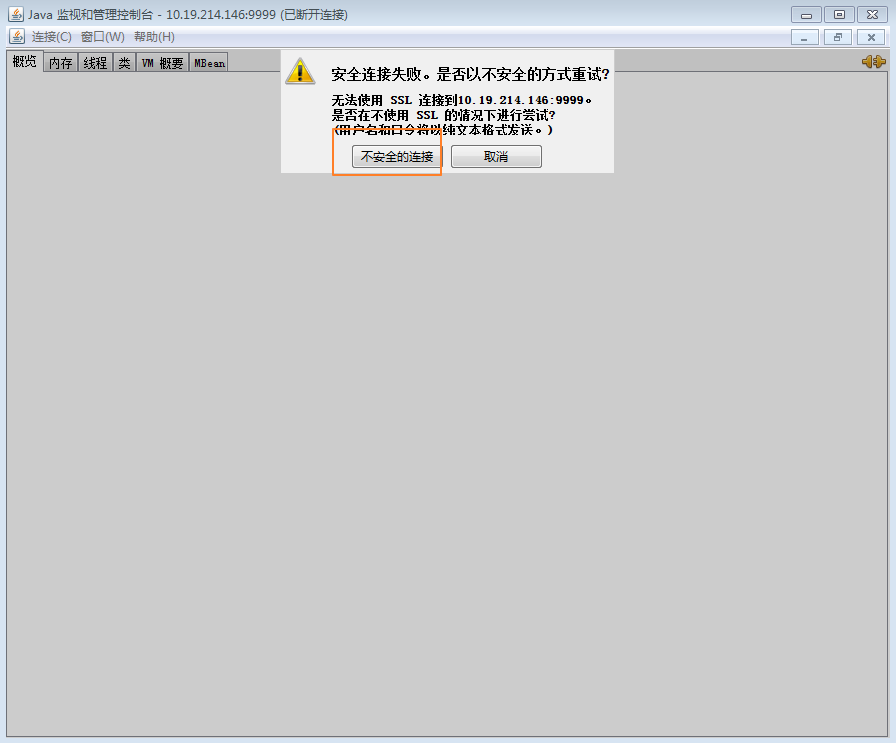
2、通过 jconsole
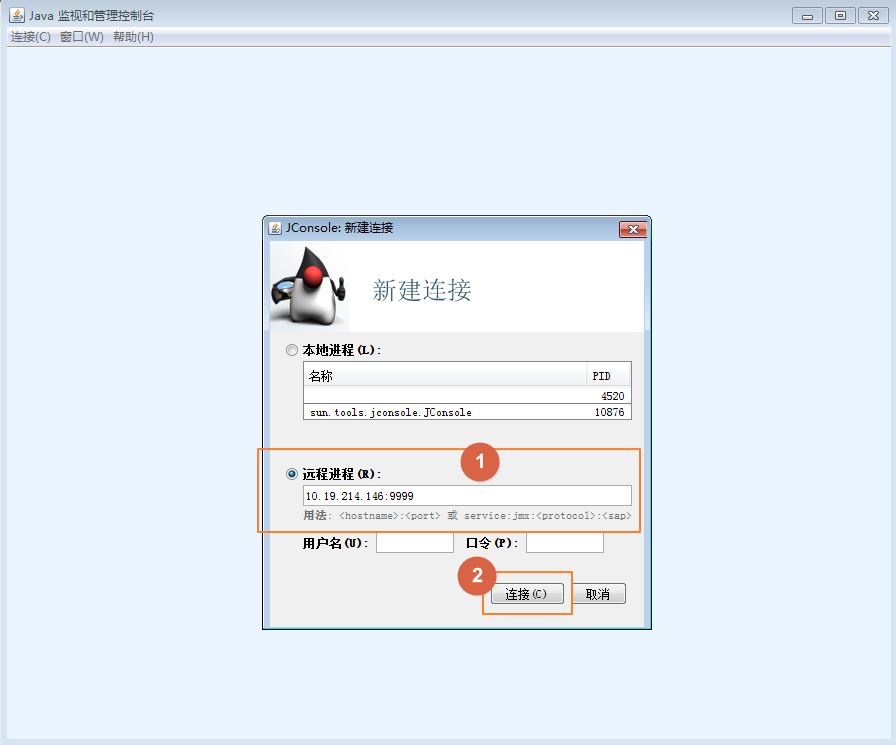
图中的 1 处填写 你要远程的 tomcat 所在 IP 以及 开放的 jmx 端口;
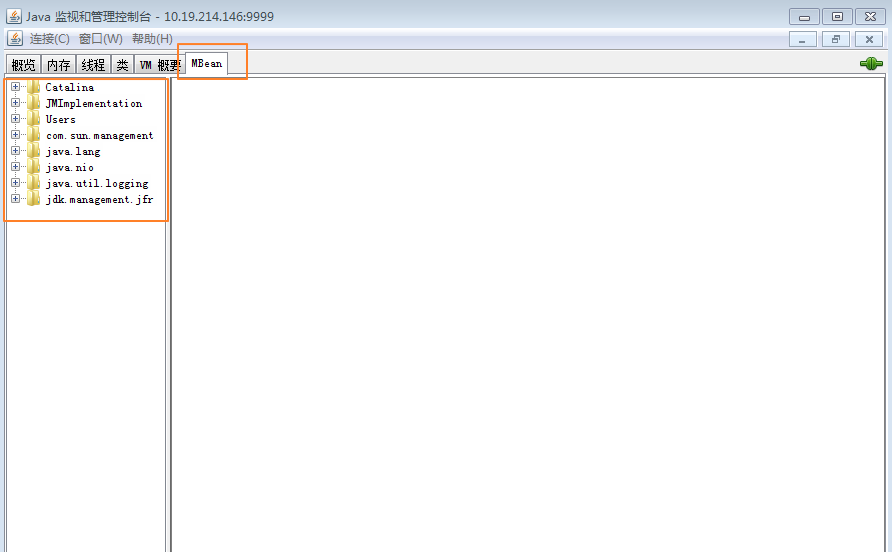
MBean 页 中记录了所有 可以监控 tomcat 的监控项。
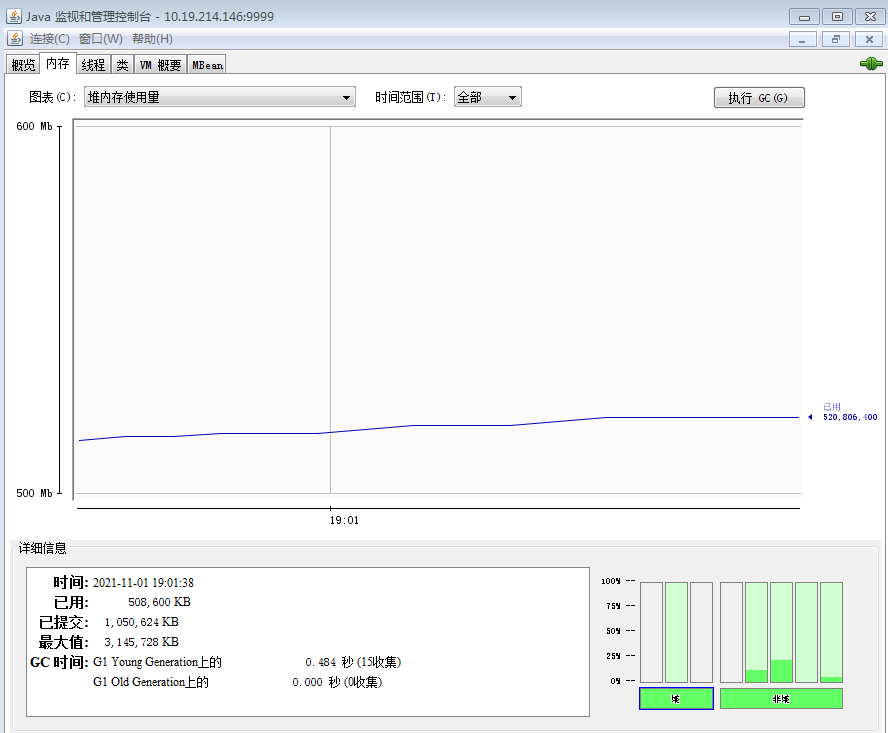
可以看到 堆内存 使用情况,其它 Tab 亦然。
其实:图中所有 Tab (除了 Mbean) 的内容都是从 Mbean 中获取的。
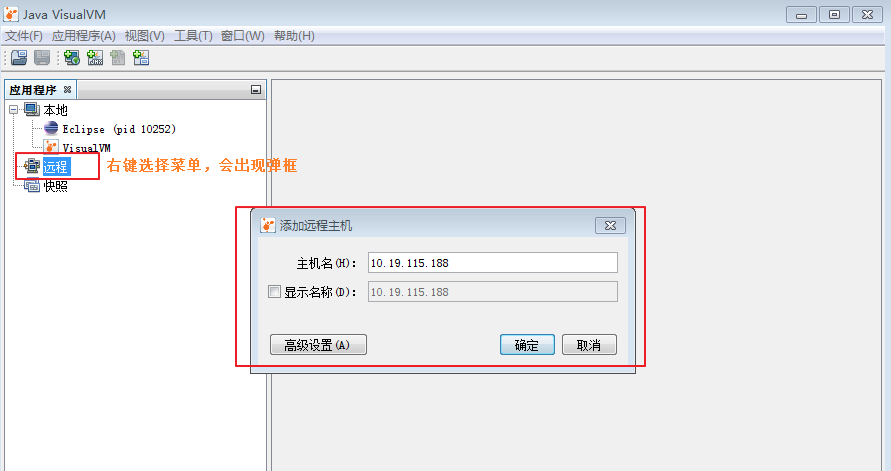
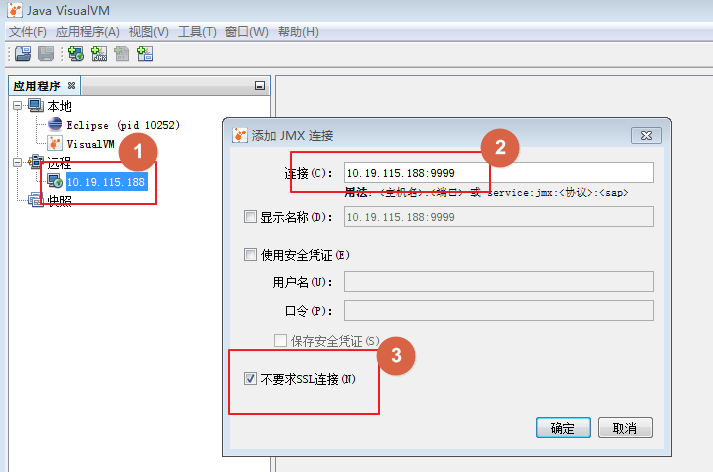
3、通过 jvisualvm 工具监控


三、集成监控软件
1、集成 prometheus
1) 在虚拟机上安装 prometheus 软件
可以查看该篇博客:https://www.cnblogs.com/fatyao/p/11007357.html
2、集成 zabbix