<script type="text/javascript">
window.onload=function(){
var play=new CanvasJS.Chart('play1',{
title:{
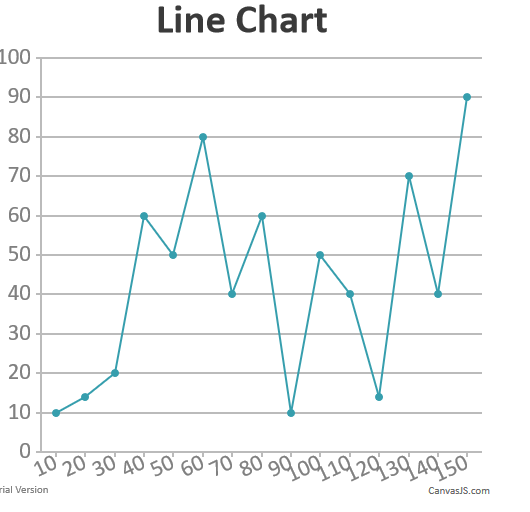
text:'Line Chart'
},
axisX:{
interval: 10
},
data:[{
type:'line',
dataPoints:[{
x:10,y:10
},
{ x: 20, y: 14 },
{ x: 30, y: 20 },
{ x: 40, y: 60 },
{ x: 50, y: 50 },
{ x: 60, y: 80 },
{ x: 70, y: 40 },
{ x: 80, y: 60 },
{ x: 90, y: 10 },
{ x: 100, y: 50 },
{ x: 110, y: 40 },
{ x: 120, y: 14 },
{ x: 130, y: 70 },
{ x: 140, y: 40 },
{ x: 150, y: 90 },
]
}]
});
play.render();
}
</script>
<script src="../../canvasjs.min.js"></script>
</head>
<body>
<div id="play1" style=" 500px;height: 500px;;">
</div>