"echarts": "^5.2.2",
ChartSituation1
<template>
<div>
<EChartTemplate1 ref="eChartTemplate1Ref"></EChartTemplate1>
</div>
</template>
<script>
import EChartTemplate1 from '../EChartTemplate1'
import mock from '../mockData'
export default {
name: 'ChartSituation1',
components: {
EChartTemplate1
},
props: {},
data () {
return {}
},
watch: {},
computed: {},
methods: {},
created () { },
activated () { },
mounted () {
const optionBusiness = {
title: '111',
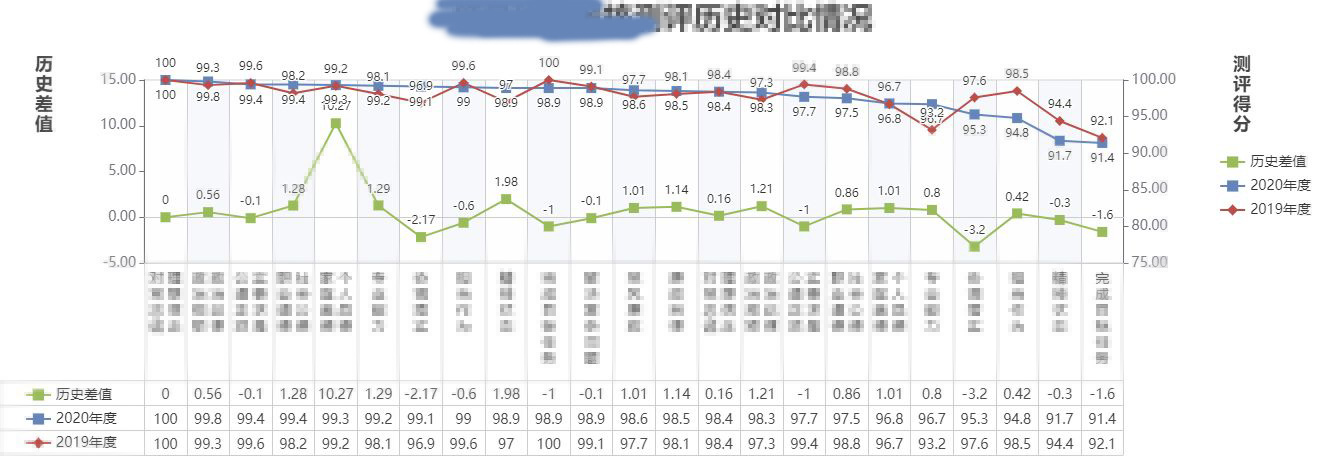
legendData: ['历史差值', '2020年度', '2019年度'],
dataDiff: mock.lishichazhi,
data1: mock.year2020,
data2: mock.year2019,
xAxisData: mock.xAxisData
}
this.$refs.eChartTemplate1Ref.open(optionBusiness)
},
beforeDestroy () { }
}
</script>
<style>
</style>
EChartTemplate1
<template>
  <div>
    <EChartComponent ref="eChartCompnentRef"></EChartComponent>
  </div>
</template>

<script>
import EChartComponent from '../EChartComponent'
export default {
  name: 'EChartTemplate1',
  components: {
    EChartComponent
  },
  props: {},
  data () {
    return {}
  },
  watch: {},
  computed: {},
  methods: {
    open (optionB) {
      const lineList = this.getTableLine(4)
      const option = {
        color: ['#99bb5c', '#6585b8', '#b84f4b'],
        grid: {
          show: true,
          containLabel: true,
          height: 'auto' - 0,
          top: 80,
          left: 100,
          right: 150,
          bottom: 10,
        },
        title: [
          {
            textStyle: { fontSize: 30 },
            left: 'center',
            text: optionB.title
          },
          {
            top: 50,
            left: 30,
            textStyle: { lineHeight: 20 },
            text: '历\n史\n差\n值'
          },
          {
            top: 50,
            right: 70,
            textStyle: { lineHeight: 20 },
            text: '测\n评\n得\n分'
          },
        ],
        xAxis: [
          {
            axisLine: {
              lineStyle: { color: '#ccc' },
              onZero: false,
            },
            position: 'bottom',
            axisTick: {
              show: true,
              length: this.getxAxisTickLength(optionB.xAxisData) // 193,
            },
            axisLabel: {
              color: '#464646',
              show: true,
              fontSize: 14,
              lineHeight: 16,
              interval: 0, // 全部显示
              rotate: 0,
              formatter: function (value, index) {
                return '{tableup|' + value + '\n}'
                  + '\n{table|' + optionB.dataDiff[index] + '}'
                  + '\n{table|' + optionB.data1[index] + '}'
                  + '\n{table|' + optionB.data2[index] + '}'
              },
              rich: {
                tableup: {
                  color: '#464646',
                  fontSize: 14,
                  lineHeight: 16,
                },
                table: {
                  color: '#464646',
                  fontSize: 14,
                  lineHeight: 25,
                }
              }
            },
            splitLine: { // 竖线
              show: true,
              lineStyle: { color: '#cccccc' }
            },
            splitArea: {
              show: true
            },
            type: 'category', // 类别
            data: this.xAxisData(optionB.xAxisData),
          },
          {
            axisLine: {
              lineStyle: {
                color: '#ccc'
              }
            }
          },
        ],
        yAxis: [
          { // 左边
            axisLabel: {
              formatter: function (value, index) {
                return value.toFixed(2)
              },
              fontSize: 14,
            },
            axisTick: {
              show: true,
            },
            splitLine: { // 横线
              show: false
            },
            min: this.getMinLeft(optionB.dataDiff, -5),
            max: this.getMaxLeft(optionB.dataDiff, 15),
            position: 'left',
            name: '',
            offset: 0,
            type: 'value'
          },
          { // 右边
            axisLabel: {
              formatter: function (value, index) {
                return value.toFixed(2)
              },
              fontSize: 14,
            },
            axisTick: {
              show: true,
            },
            splitLine: {
              show: false
            },
            min: this.getMinRight([...optionB.data1, ...optionB.data2], 75.00),
            max: this.getMaxRight([...optionB.data1, ...optionB.data2], 100.00),
            position: 'right',
            name: '',
            type: 'value'
          }
        ],
        legend: [
          {
            textStyle: { fontSize: 14 },
            orient: 'vertical',
            right: 10,
            top: 150,
            data: optionB.legendData
          },
          {
            textStyle: { fontSize: 14 },
            orient: 'vertical',
            left: 20,
            bottom: 13,
            data: optionB.legendData
          }
        ],
        series: [
          {
            label: {
              show: true,
              position: 'top'
            },
            symbol: 'rect',
            symbolSize: 10,
            yAxisIndex: 0,
            type: 'line',
            name: optionB.legendData[0],
            data: optionB.dataDiff,
          },
          {
            label: {
              show: true,
              position: 'bottom'
            },
            symbol: 'rect',
            symbolSize: 10,
            type: 'line',
            name: optionB.legendData[1],
            yAxisIndex: 1,
            data: optionB.data1,
          },
          {
            label: {
              show: true,
              position: 'top'
            },
            symbolSize: 10,
            type: 'line',
            symbol: 'diamond',
            name: '2019年度',
            yAxisIndex: 1,
            data: optionB.data2,
          },
        ],
        graphic: lineList
      }
      this.$refs.eChartCompnentRef.open(option)
    },
    getxAxisTickLength (data) {
      const arr = this.xAxisData(data)
      const getEnterNumber = str => {
        return str.split('\n').length
      }
      const numArr = arr.map(item => {
        return getEnterNumber(item)
      })
      const maxNum = Math.max(...numArr)
      // 16 是 lineHeight 多补了个回车 再加16 上面的padding是5
      // 25 是数据的 lineHeight 3行
      return maxNum * 16 + 16 + 5 + 25 * 3
    },
    getMinLeft (arr, defaultValue) { // 左侧轴 最小值计算
      const min = Math.min(...arr)
      if (min > defaultValue) {
        return defaultValue
      } else {
        return parseInt(min - 2)
      }
    },
    getMaxLeft (arr, defaultValue) { // 左侧轴 最大值计算
      const max = Math.max(...arr)
      if (max < defaultValue) {
        return defaultValue
      } else {
        return parseInt(max + 2)
      }
    },
    getMinRight (arr, defaultValue) { // 右侧轴 最小值计算
      const min = Math.min(...arr)
      if (min > defaultValue) {
        return defaultValue
      } else {
        if (min <= 2) {
          return 0
        }
        return parseInt(min - 2)
      }
    },
    getMaxRight (arr, defaultValue) { // 右侧轴 最大值计算
      const max = Math.max(...arr)
      if (max < defaultValue) {
        return defaultValue
      } else {
        if (max >= 98) {
          return 100
        }
        return parseInt(max + 2)
      }
    },
    getTableLine (num) {
      let list = []
      let bottom = 85
      let height = 25
      for (let i = 0; i < num; i++) {
        list.push({
          silent: true,
          type: 'line',
          bottom: bottom - i * height,
          // left: 50,
          right: 150 + 50,
          style: {
            stroke: 'inherit'
          },
          shape: {
            x1: 0,
            y1: 0,
            x2: 3000,
            y2: 0
          }

        })
      }
      list.push({
        style: {
          stroke: 'inherit'
        },
        bottom: 10,
        silent: true,
        type: 'line',
        shape: {
          x1: 0,
          y1: 0,
          x2: 0,
          y2: 75
        }
      })
      return list
    },
    xAxisData (data) {
      const ret = data.map(item => {
        if (item.indexOf(' ') > -1) {
          const t2 = item.split(' ')
          const a = t2[0].split('')
          const b = t2[1].split('')
          let k
          if (a.length > b.length) {
            k = a
          } else {
            k = b
          }
          const ret = k.map((item1, index) => {
            const a1 = a[index] ? a[index] : ' '
            const b1 = b[index] ? b[index] : ' '
            return a1 + ' ' + b1 + '\n'
          }).join('')
          return ret
        }
        return item.split('').join('\n')
      })
      const getEnterNumber = str => {
        return str.split('\n').length
      }
      const getMaxNumber = arr => {
        return Math.max(...arr)
      }
      const repeat = (src, n) => {
        let k = ''
        for (let i = 0; i < n; i++) {
          k = k + src
        }
        return k
      }
      const supplementEnter = (str, maxNumber) => { // 补上回车
        const enterLen = getEnterNumber(str)
        const needNumber = maxNumber - enterLen
        const n = repeat('\n', needNumber)
        return str + n
      }

      const maxNumber = getMaxNumber(ret.map(item => {
        return getEnterNumber(item)
      }))
      const ret1 = ret.map(item => {
        return supplementEnter(item, maxNumber)
      })
      return ret1
    }
  },
  created () { },
  activated () { },
  mounted () {
  },
  beforeDestroy () { }
}
</script>

<style>
</style>
EChartComponent
<template>
  <div v-if="chartVif">
    <ResizeZen @on-change="chartHeightSet"></ResizeZen>
    <div ref="dom"
         :style="{height: chartHeight + 'px'}"
         style=" 100%;"></div>
  </div>
</template>

<script>
import * as echarts from 'echarts'
export default {
  name: 'EChartComponent',
  components: {},
  props: {},
  data () {
    return {
      chartVif: false,
      chartHeight: '550',
      myChart: null
    }
  },
  watch: {},
  computed: {},
  methods: {
    chartHeightSet () {
      this.chartHeight = window.innerHeight - 300
      this.$nextTick(() => {
        this.myChart.resize()
      })
    },
    openChartVifSet (ctx, next) {
      this.chartVif = false
      this.$nextTick(() => {
        this.chartVif = true
        this.$nextTick(() => {
          next()
        })
      })
    },
    openExe (ctx, next) {
      this.myChart = echarts.init(this.$refs.dom)
      this.myChart.setOption(ctx.option)
      this.chartHeightSet()
    },
    open (option) {
      const ac = this.$getAc()
      ac.ctx.option = option
      ac.use(this.openChartVifSet)
      ac.use(this.openExe)
      ac.run()
    }
  },
  created () { },
  activated () { },
  mounted () { },
  beforeDestroy () { }
}
</script>

<style>
</style>
ResizeZen
<template>
  <span></span>
</template>

<script>
// window.innerHeight
export default {
  name: 'ResizeZen',
  components: {},
  props: {},
  data () {
    return {}
  },
  watch: {},
  computed: {},
  methods: {
    resize () {
      this.$emit('on-change')
    }
  },
  created () { },
  activated () { },
  mounted () {
    window.addEventListener('resize', this.resize)
  },
  beforeDestroy () {
    window.removeEventListener('resize', this.resize)
  }
}
</script>

<style>
</style>