通过简单的颜色选择,我们设法消除了图像中除了车道线以外的几乎所有内容。但是,在这一点上,自动提取确切的线条仍然非常棘手,因为我们仍然在周边检测到了一些不是线条线的其他物体。
在这种情况下,我将假定拍摄图像的前置摄像头安装在汽车的固定位置,这样车道线总是会出现在图像的同一区域。 所以在提取行车线的时候,只关注这个梯形区域内的图像,可以避免其他区域的信息造成干扰。这个梯形区域如果选取地太大,则会引入更多无关信息(比如护栏,树木等),如果梯形区域选取太小,则可能看不见行车线,所以这里需要权衡。接下来,我将通过添加一个标准来考虑这一点,仅在我们期望找到车道线的区域考虑用于颜色选择的像素。
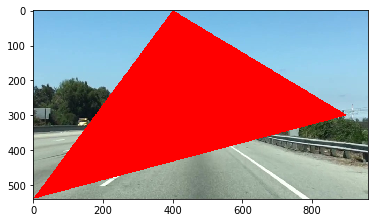
看看下面的代码。 变量left_bottom,right_bottom和apex代表了我想保留用于颜色选择的三角形区域的顶点,同时掩盖了其他所有内容。 在这里,我使用三角形面具来说明最简单的情况,但稍后您将使用四边形,原则上可以使用任何多边形。numpy.polyfit(x,y,n)是用于多项式求过已知点的表达式,其中x为源数据点对应的横坐标,可为行向量、矩阵,y为源数据点对应的纵坐标,可为行向量、矩阵,n为你要拟合的阶数,一阶直线拟合,二阶抛物线拟合,并非阶次越高越好,看拟合情况而定。
 1  import matplotlib.pyplot as plt
 2  import matplotlib.image as mpimg
 3  import numpy as np
 4
 5  # Read in the image and print some stats
 6  image = mpimg.imread('E:/spyder/a/a/test.jpg')
 7  print('This image is: ', type(image),
 8           'with dimensions:', image.shape)
 9   # Pull out the x and y sizes and make a copy of the image
10  ysize = image.shape[0]
11  xsize = image.shape[1]
12  region_select = np.copy(image)
13
14  # Define a triangle region of interest
15  # Keep in mind the origin (x=0, y=0) is in the upper left in image processing
16  # Note: if you run this code, you'll find these are not sensible values!!
17  # But you'll get a chance to play with them soon in a quiz
18  left_bottom = [0, 539]
19  right_bottom = [900, 300]
20  apex = [400, 0]
21
22  # Fit lines (y=Ax+B) to identify the  3 sided region of interest
23  # np.polyfit() returns the coefficients [A, B] of the fit
24  fit_left = np.polyfit((left_bottom[0], apex[0]), (left_bottom[1], apex[1]), 1)
25  fit_right = np.polyfit((right_bottom[0], apex[0]), (right_bottom[1], apex[1]), 1)
26  fit_bottom = np.polyfit((left_bottom[0], right_bottom[0]), (left_bottom[1], right_bottom[1]), 1)
27
28  # Find the region inside the lines
29  XX, YY = np.meshgrid(np.arange(0, xsize), np.arange(0, ysize))
30  region_thresholds = (YY > (XX*fit_left[0] + fit_left[1])) &
31                      (YY > (XX*fit_right[0] + fit_right[1])) &
32                      (YY < (XX*fit_bottom[0] + fit_bottom[1]))
33
34  # Color pixels red which are inside the region of interest
35  region_select[region_thresholds] = [255, 0, 0]
36
37  # Display the image
38  plt.imshow(region_select)
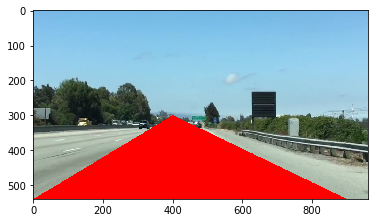
若19~21的代码改为如下:
19 left_bottom = [0, 540]
20 right_bottom = [900, 540]
21 apex = [400, 300]
则为: