#计算鸢尾花花瓣长度的最大值,平均值,中值,均方差。
#用np.random.normal()产生一个正态分布的随机数组,并显示出来。
#np.random.randn()产生一个正态分布的随机数组,并显示出来。
#显示鸢尾花花瓣长度的正态分布图,曲线图,散点图。
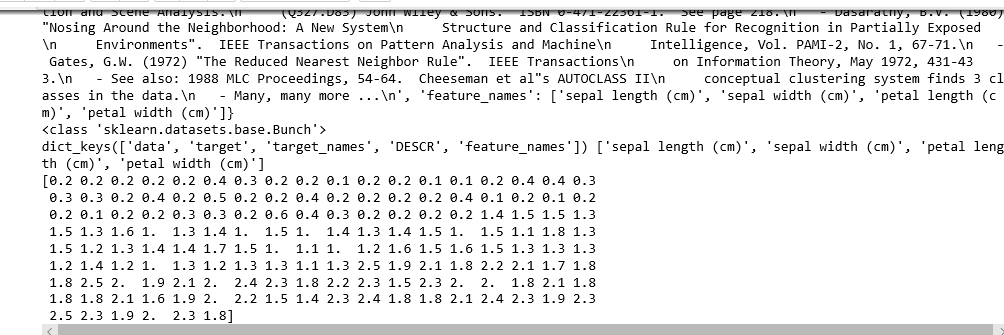
# 导包
import numpy as np

# 从sklearn包自带的数据集中读出鸢尾花数据集data
from sklearn.datasets import load_iris
data = load_iris()
print(data)
print(type(data))
print(data.keys(),data.feature_names)
iris = data.data
petal_len = iris[:,3]
print(petal_len)
运行结果:

#计算鸢尾花花瓣长度的最大值,平均值,中值,均方差。
print("最大值:",np.max(petal_len))
print("平均值:",np.mean(petal_len))
print("中值:",np.median(pental_len))
print("均方差:",np.std(pental_len))
运行结果:

#用np.random.normal()产生一个正态分布的随机数组,并显示出来。
data_rand=np.random.normal(1,5,10) #随机生成10个正态分布
print(data_rand)
运行结果:

#np.random.randn()产生一个正态分布的随机数组,并显示出来。
data_rand = np.random.randn(3,3) #随机生成三行三列的正态分布
print(data_rand)
运行结果:

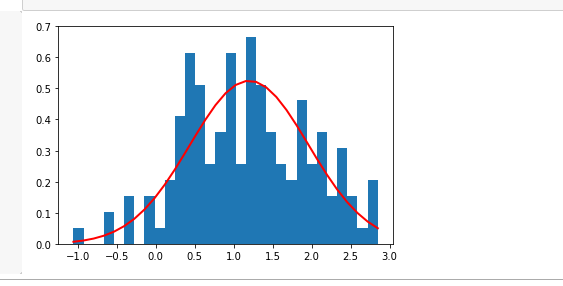
#显示鸢尾花花瓣长度的正态分布图,曲线图,散点图。

#正态分布图
import matplotlib.pyplot as plt
mu = np.mean(petal_len)
sigma = np.std(petal_len)
num = len(petal_len)
rand_data = np.random.normal(mu,sigma,num)
count, bins, ignored = plt.hist(rand_data, 30, normed=True)
plt.plot(bins, 1/(sigma * np.sqrt(2 * np.pi)) *np.exp( - (bins - mu)**2 / (2 * sigma**2)), linewidth=2, color='r')
plt.show()
运行结果:
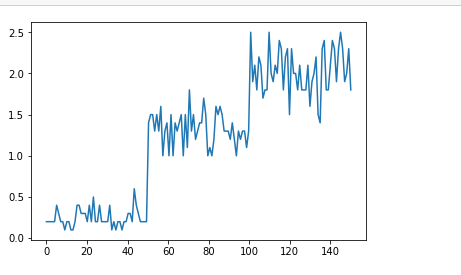
#曲线图
x = np.linspace(0,len(petal_len),num=150) #将花瓣信息分成150个等距数组
y = petal_len
plt.plot(x,y)
plt.show()
运行结果:
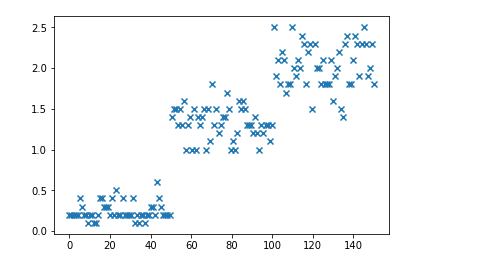
#散点图
x = np.linspace(0,len(petal_len),num=150) #将花瓣信息分成150个等距数组
y = petal_len
plt.scatter(x,y,marker = "x")
plt.show()
运行结果: