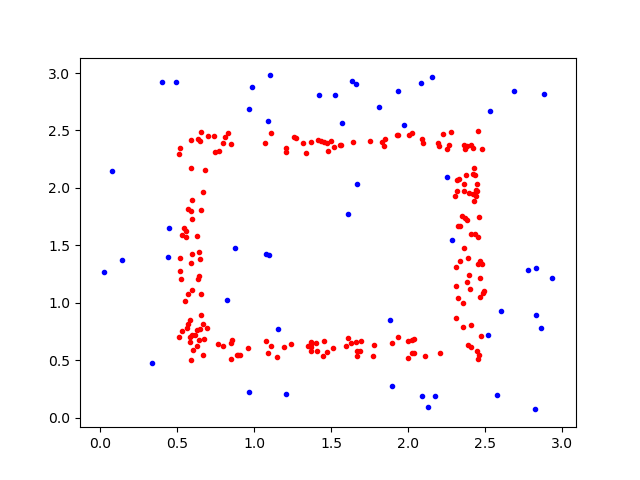
生成如图所示的环形数据集,这里外矩形的X跟Y的范围为(0.5,2.5),内矩形X跟Y的范围为(0.7,2.3)。

原理:依次迭代生成先生成均匀分布的在大矩形内的数据点,在判断生成的每个数据点是否落在介于大矩形跟小矩形中即环中,若落在环中,则保留这个点。 若生成的点的数量到预期值,则停止迭代。
若直接生成介于环中的数据,则环中的数据点会不均匀,因为四角会重复生成。
加入噪声与生成数据类似,只是判断若生成的噪声不在环形中,则此数据为噪声数据。
def get_data(num_point,num_noise,seed):
    """
    生成环形数据与噪声
    @param num_point: 正常数据点的个数
    @param num_noise: 噪声的个数
    @param seed: 随机数种子。若seed值设置的一样,则每次随机生成的数据点都一样
    @return: 环形数据,噪声
    """
    np.random.seed(seed)
    # 设置生成环形的坐标数据,即大矩形跟小矩形坐标
    X_small = (0.7, 2.3)
    Y_small = (0.7, 2.3)
    X_large = (0.5, 2.5)
    Y_large = (0.5, 2.5)
    point = []
    # 若生成的点的数量没有到达预期目标将不停迭代
    while len(point)!=num_point:
        #生成介于大矩形的均匀分布的数据点
        X_point = X_large[0] + (X_large[1]-X_large[0]) * np.random.rand()
        Y_point = Y_large[0] + (Y_large[1]-Y_large[0]) * np.random.rand()
        #判断此点是否符合要求
        if (X_large[0]<X_point<X_small[0] or X_small[1]<X_point<X_large[1]
        or Y_large[0]<Y_point<Y_small[0] or Y_small[1]<Y_point<Y_large[1]):
            point.append((X_point, Y_point))
    point = np.array(point)
    #生成噪声
    noise_Xcor = (0,3)
    noise_Ycor = (0,3)
    noise = []
    while len(noise) != num_noise:
        X_noise = noise_Xcor[0]+(noise_Xcor[1]-noise_Xcor[0]) * np.random.rand()
        Y_noise = noise_Ycor[0]+(noise_Ycor[1]-noise_Ycor[0]) * np.random.rand()
        if not (X_large[0]<X_noise<X_small[0] or X_small[1]<X_noise<X_large[1]
        or Y_large[0]<Y_noise<Y_small[0] or Y_small[1]<Y_noise<Y_large[1]):
            noise.append((X_noise, Y_noise))
    return np.array(point),np.array(noise)
绘制最终图形
def draw(data_point, data_noise):
    '''
    绘制图像
    @param data_point: 环形数据
    @param data_noise: 噪声
    @return:
    '''
    fig = plt.figure()
    ax = fig.add_subplot(111)
    plt.scatter(data_point[:, 0], data_point[:, 1], c='r', marker='.')
    plt.scatter(data_noise[:, 0], data_noise[:, 1], c='b', marker='.')
    plt.show()