首先,定义柱状图,并设置自定义的DataTemplate


        <telerik:RadCartesianChart >
            <telerik:RadCartesianChart.HorizontalAxis>
                <telerik:LinearAxis Minimum="0"/>
            </telerik:RadCartesianChart.HorizontalAxis>
            <telerik:RadCartesianChart.VerticalAxis>
                <telerik:CategoricalAxis IsInverse="True" />
            </telerik:RadCartesianChart.VerticalAxis>
            <telerik:RadCartesianChart.Grid>
                <telerik:CartesianChartGrid MajorLinesVisibility="X" />
            </telerik:RadCartesianChart.Grid>
            <telerik:BarSeries ItemsSource="{Binding ChartDatas}" CategoryBinding="Name" ValueBinding="Value" ShowLabels="True" IsSelected="True" >
                <telerik:BarSeries.PointTemplate>
                    <DataTemplate>
                        <kpiCtrl:Histogram CategoryName="{Binding Converter={StaticResource histogramColorConverter}}"/>
                    </DataTemplate>
                </telerik:BarSeries.PointTemplate>
                <telerik:BarSeries.LabelDefinitions>
                    <telerik:ChartSeriesLabelDefinition Format="{}{0:0.00}" HorizontalAlignment="Center" VerticalAlignment="Center" DefaultVisualStyle="{StaticResource barSeriesLabelStyle}" />
                </telerik:BarSeries.LabelDefinitions>
            </telerik:BarSeries>
        </telerik:RadCartesianChart>
接着自定义用户控件:Histogram,CategoryName属性用来区分不同属性名显示不同色系
    public partial class Histogram : UserControl
    {
        public Histogram()
        {
            InitializeComponent();
        }

        public string CategoryName
        {
            get { return (string)GetValue(CategoryNameProperty); }
            set { SetValue(CategoryNameProperty, value); }
        }

        public static readonly DependencyProperty CategoryNameProperty =
            DependencyProperty.Register("CategoryName", typeof(string), typeof(Histogram), new PropertyMetadata(null,new PropertyChangedCallback(CategoryNameChanged)));

        private static void CategoryNameChanged(DependencyObject d, DependencyPropertyChangedEventArgs e)
        {
            var obj = d as Histogram;
            if (obj != null && obj.CategoryName == "限值")
            {
               obj.rect1.Fill=new SolidColorBrush(Color.FromRgb(246,188,16));
               obj.rect2.Fill = new SolidColorBrush(Color.FromRgb(194, 153, 11));
               obj.rect3.Fill = new SolidColorBrush(Color.FromRgb(158, 123, 3));
            }
            else
            {
                obj.rect1.Fill = new SolidColorBrush(Color.FromRgb(175, 216, 248));
                obj.rect2.Fill = new SolidColorBrush(Color.FromRgb(135, 173, 196));
                obj.rect3.Fill = new SolidColorBrush(Color.FromRgb(111, 139, 161));
            }
        }
    }
<UserControl x:Class="RunTime.WPF.UserCtrl.KpiCtrl.Histogram"
             xmlns="http://schemas.microsoft.com/winfx/2006/xaml/presentation"
             xmlns:x="http://schemas.microsoft.com/winfx/2006/xaml"
             xmlns:mc="http://schemas.openxmlformats.org/markup-compatibility/2006"
             xmlns:d="http://schemas.microsoft.com/expression/blend/2008"
             mc:Ignorable="d"
             d:DesignHeight="300" d:DesignWidth="300">
    <Grid Height="80">
        <Grid.ColumnDefinitions>
            <ColumnDefinition Width="*"/>
            <ColumnDefinition Width="20"/>
        </Grid.ColumnDefinitions>
        <Grid.RowDefinitions>
            <RowDefinition Height="*"/>
            <RowDefinition Height="20"/>
        </Grid.RowDefinitions>
        <Rectangle Fill="#AFD8F8" Grid.Column="0" Grid.Row="0" x:Name="rect1"/>
        <Rectangle Fill="#87ADC4" Grid.Column="1" Grid.Row="0" x:Name="rect2">
            <Rectangle.RenderTransform>
                <SkewTransform AngleX="0" AngleY="45"></SkewTransform>
            </Rectangle.RenderTransform>
        </Rectangle>
        <Rectangle Fill="#6F8BA1"  Grid.Row="1" Grid.Column="0" x:Name="rect3">
            <Rectangle.RenderTransform>
                <SkewTransform AngleX="45" AngleY="0"></SkewTransform>
            </Rectangle.RenderTransform>
        </Rectangle>
    </Grid>
</UserControl>
别忘了把将CategoricalDataPoint中的Category属性转换成绑定的属性
    /// <summary>
    /// 柱图Category转换
    /// </summary>
    public class HistogramColorConverter : IValueConverter
    {
        public object Convert(object value, Type targetType, object parameter, CultureInfo culture)
        {
            var cat = value as CategoricalDataPoint;
            if (cat != null) return cat.Category.ToString();
            return string.Empty;
        }

        public object ConvertBack(object value, Type targetType, object parameter, CultureInfo culture)
        {
            throw new NotImplementedException();
        }
    }
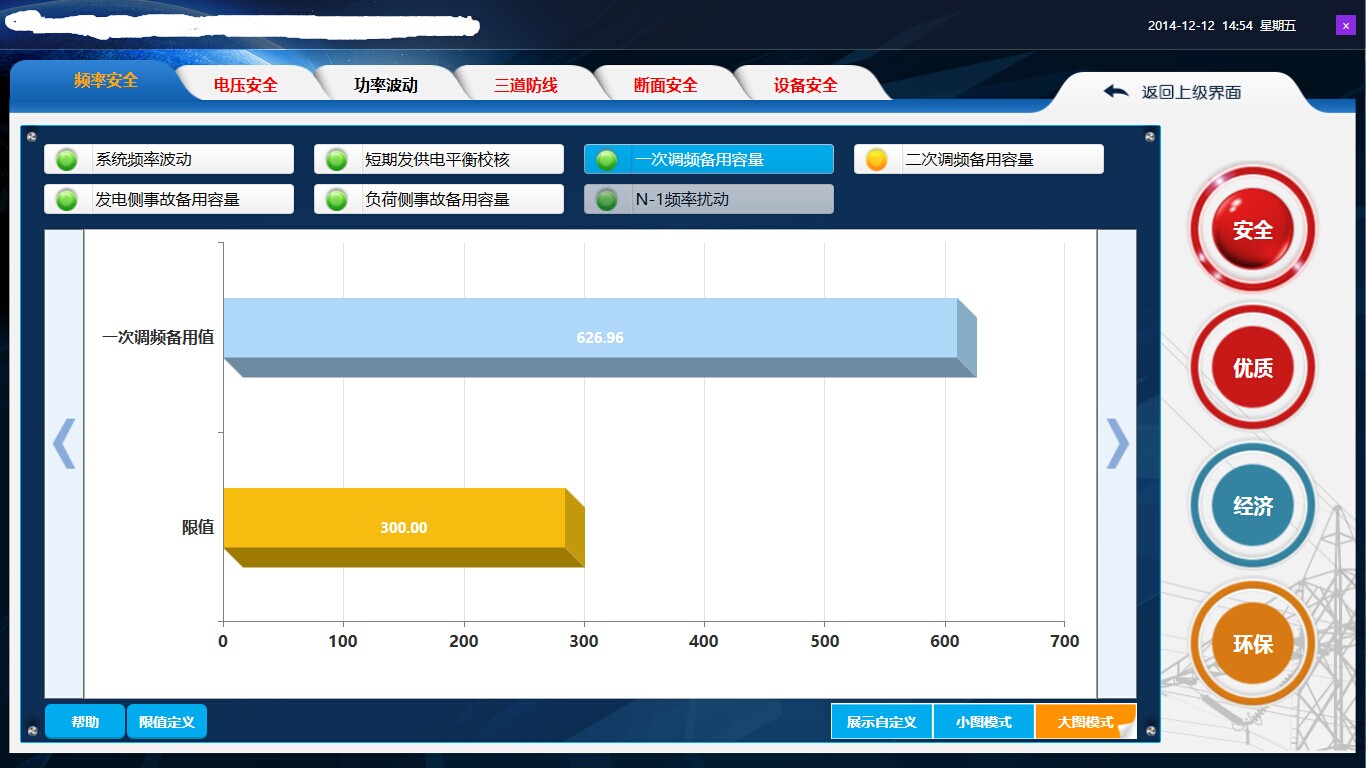
完工,看看3D柱图效果