Echarts 饼状图代码解析:
在当前页面,需要为ECharts 准备一个具备高宽的 DOM 容器
<div className='pie-chart'>
     <div id='pieChart' />
     </div>
</div>
然后需要设置配置信息,ECharts 库使用 json 格式来配置
const myChart = echarts.init(document.getElementById('pieChart'))
myChart.setOption(option)
声明图标中的数据
const echartsData = [
      {
        value: offer,
       //数据项值
        name: 'offer'
       //数据项名称
        itemStyle: {
        //itemStyle 参数可以设置诸如颜色、边框颜色、边框宽度等样式:
          color: 'rgba(0, 153, 168, 1)'
        }
      },
      {
        value: pie1,
        name: 'pie chart1',
        itemStyle: {
          color: 'rgba(67, 134, 1, 1)'
        }
      },
      {
        value: pie2,
        name: `pie chart2',
        itemStyle: {
          color: 'rgba(110, 46, 95, 1)'
        }
      }
    ]
配置参数声明:
const option = {
   //系列是一个数组,数组的每一项都代表着一个单独的系列,可以配置各种图形等等功能。
      series: [
        {
          type: 'pie',//图表的类型,pie-饼图
        //  type: 'bar':柱状/条形图
        //  type: 'line':折线/面积图
          //饼图的半径,外半径为可视区尺寸(容器高宽中较小一项)的 55% 长度。
          radius: ['50%', '70%'],
         //是否启用防止标签重叠策略,默认开启
          avoidLabelOverlap: false,
          label: {
            show: false,
            position: 'center'
          },
        //在鼠标悬浮到图形元素上时,一般会出现高亮的样式。emphasis自定义高亮样式。
          emphasis: {
            label: {
              show: true,
              color: '#666666',
              lineHeight: '20',
              backgroundColor: '#ffffff',
              borderColor: '#f4f4f4',
              shadowBlur: 10,
              borderWidth: 1,
              borderRadius: 2,
              fontSize: '12',
              fontWeight: 'bold'
            }
          },
          labelLine: { //指示线
            show: false
          },
          data: echartsData//数据数组
        }
      ]
    }
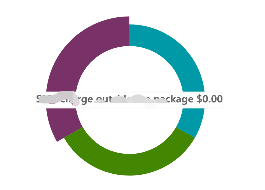
实现效果: