ELK——日志收集分析平台
ELK简介:
在开源的日志管理方案之中,最出名的莫过于ELK了,ELK由ElasticSearch、Logstash和Kiabana三个开源工具组成。
1)ElasticSearch是一个基于Lucene的开源分布式搜索服务器。
它的特点有:分布式,零配置,自动发现,索引自动分片,索引副本机制,restful风格接口,多数据源,自动搜索负载等。
它提供了一个分布式多用户能力的全文搜索引擎,基于RESTful web接口。
Elasticsearch是用Java开发的,并作为Apache许可条款下的开放源码发布,是第二流行的企业搜索引擎。
设计用于云计算中,能够达到实时搜索,稳定,可靠,快速,安装使用方便。
在elasticsearch中,所有节点的数据是均等的。
2)Logstash是一个完全开源的工具,它可以对你的日志进行收集、过滤、分析,支持大量的数据获取方法,并将其存储供以后使用(如搜索)。
说到搜索,logstash带有一个web界面,搜索和展示所有日志。
一般工作方式为c/s架构,client端安装在需要收集日志的主机上,server端负责将收到的各节点日志进行过滤、修改等操作在一并发往elasticsearch上去。
说到搜索,logstash带有一个web界面,搜索和展示所有日志。
一般工作方式为c/s架构,client端安装在需要收集日志的主机上,server端负责将收到的各节点日志进行过滤、修改等操作在一并发往elasticsearch上去。
3)Kibana 是一个基于浏览器页面的Elasticsearch前端展示工具,也是一个开源和免费的工具,Kibana可以为 Logstash 和 ElasticSearch 提供的日志分析友好的 Web 界面,可以帮助您汇总、分析和搜索重要数据日志。
工作流程:logstash负责从各个docker容器中提取日志(做了volume,配置path即可),然后将读取到的日志转发到ElasticSearch进行索引和保存,Kibana分析和可视化数据。
#注:在这里我们使用了filebeat代替了logstash
ELK的安装部署:
1、下载下面的三个软件https://www.elastic.co/cn/products
[root@centos ~]# ls
elasticsearch-7.1.0-x86_64.rpm kibana-7.1.0-x86_64.rpm filebeat-7.1.0-x86_64.rpm
2、下载java环境
[root@centos ~]# yum install java -y
3、安装ELK
[root@centos ~]# yum install elasticsearch-7.1.0-x86_64.rpm kibana-7.1.0-x86_64.rpm filebeat-7.1.0-x86_64.rpm -y
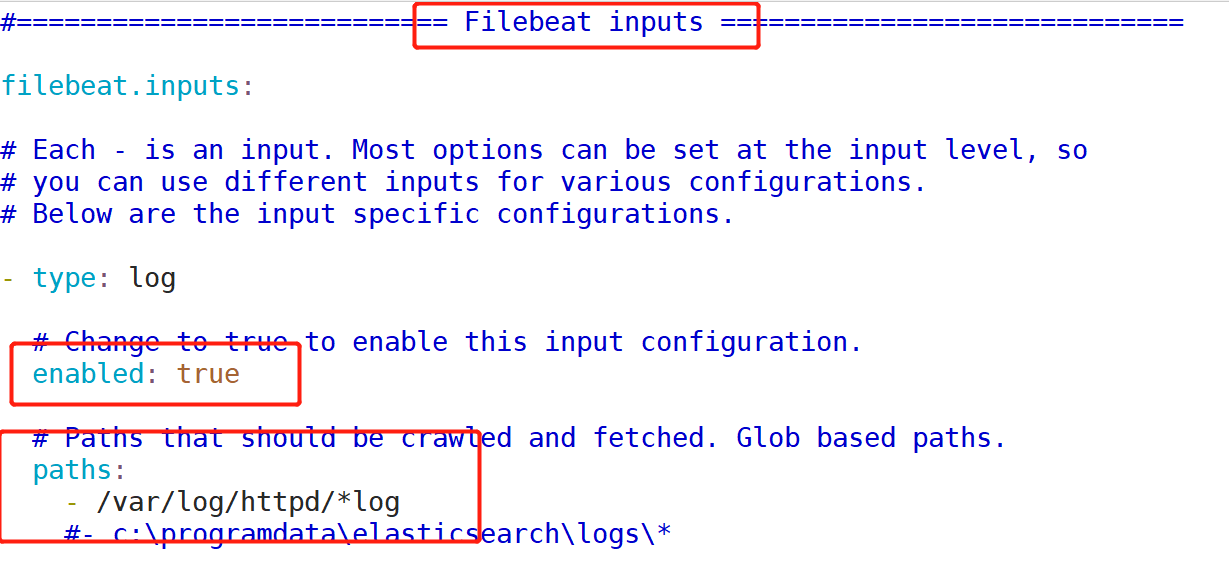
配置filebeat:vim /etc/filebeat/filebete.yml
在inputs项中
将enabled改为true 同时配置你的paths
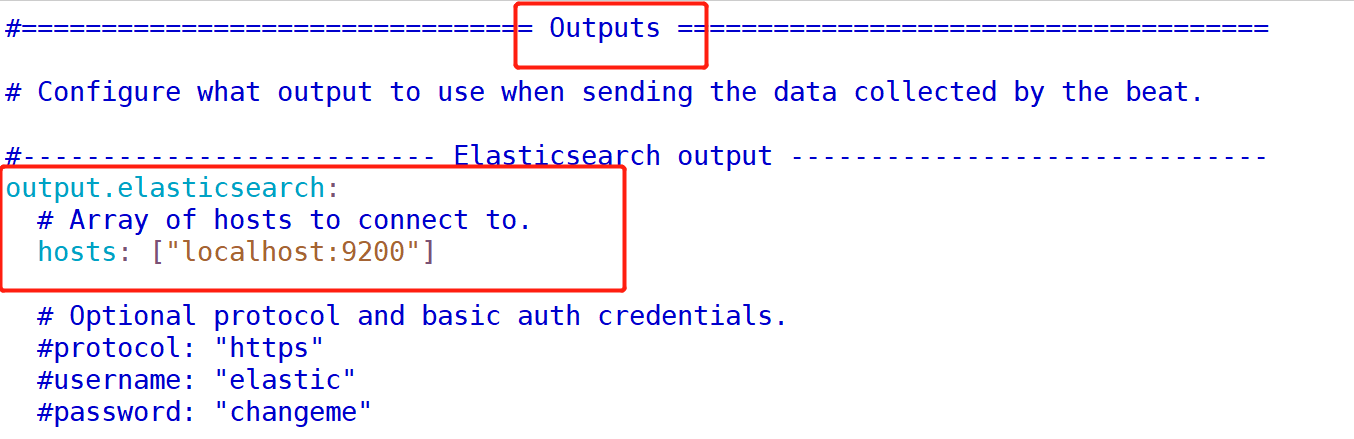
在outputs项中更改hosts
在inputs项中
将enabled改为true 同时配置你的paths
在outputs项中更改hosts
然后重启filebeat:systemctl restart filebeat
elasticsearch启动
systemctl restart elasticsearch
kibana启动
1、修改监听地址
[root@centos ~]# vim /etc/kibana/kibana.yml
server.host: “192.168.64.4” #这是你要使用浏览器访问的ip
2、重启kibana
[root@centos ~]# systemctl restart kibana
查看所有端口
[root@centos ~]# ss -tnl
State Recv-Q Send-Q Local Address:Port Peer Address:Port
LISTEN 0 128 192.168.64.4:5601 *:*
LISTEN 0 128 *:22 *:*
LISTEN 0 100 127.0.0.1:25 *:*
LISTEN 0 128 ::ffff:127.0.0.1:9200 :::*
LISTEN 0 128 ::1:9200 :::*
LISTEN 0 128 ::ffff:127.0.0.1:9300 :::*
LISTEN 0 128 ::1:9300 :::*
LISTEN 0 128 :::22 :::*
LISTEN 0 100 ::1:25 :::*
浏览器访问kibana
输入服务器IP指定kibana端口5601,然后即可使用。
EFK搭建
安装java
安装java1.8以上的版本并验证
[root@localhost ~]# yum install java
[root@localhost ~]# java -version
openjdk version "1.8.0_222"
OpenJDK Runtime Environment (build 1.8.0_222-b10)
OpenJDK 64-Bit Server VM (build 25.222-b10, mixed mode)
安装Elasticsearch
安装Elasticsearch(Elasticsearch、Kibana、FileBeat版本最好一致)

[root@localhost ~]# wget https://artifacts.elastic.co/downloads/elasticsearch/elasticsearch-6.2.4.tar.gz
[root@localhost ~]# tar -zxvf elasticsearch-6.2.4.tar.gz
[root@localhost ~]# mv elasticsearch-6.2.4 /usr/local/elasticsearch-6.2.4
[root@localhost ~]# cd /usr/local/elasticsearch-6.2.4
[root@localhost ~]# vi config/elasticsearch.yml
    network.host: 0.0.0.0
    http.port: 9200

#由于这里不能直接用root用户运行elasticsearch,所以要创建一个新用户
[root@localhost ~]# adduser fengzi
[root@localhost ~]# passwd fengzi
[root@localhost ~]# chmod -R 777 /usr/local/elasticsearch-6.2.4
[root@localhost ~]# su fengzi

#启动elasticsearch
[root@localhost ~]# ./bin/elasticsearch
如果服务启动不起来,以下是解决办法
#添加以下4行内容
[root@localhost local]# vim /etc/security/limits.conf
        * soft nofile 65536
        * hard nofile 65536
        efk soft nproc 8192
        efk hard nproc 8192

#修改成以下内容
[root@localhost local]# vim /etc/security/limits.d/20-nproc.conf
        *          soft    nproc    4096
        root       soft    nproc     unlimited

#添加如下一行
[root@localhost local]# vim /etc/sysctl.conf
        vm.max_map_count=655360
[root@localhost local]# sysctl -p
#查看一下9200和9300端口有没有启
[root@localhost local]# ss -tnl
State       Recv-Q Send-Q              Local Address:Port                             Peer Address:Port
LISTEN      0      128                             *:22                                          *:*
LISTEN      0      100                     127.0.0.1:25                                          *:*
LISTEN      0      80                             :::3306                                       :::*
LISTEN      0      128                            :::9200                                       :::*
LISTEN      0      128                            :::9300                                       :::*
LISTEN      0      128                            :::22                                         :::*
LISTEN      0      100                           ::1:25                                         :::*
安装Kibana
[root@localhost local]# wget https://artifacts.elastic.co/downloads/kibana/kibana-6.2.4-linux-x86_64.tar.gz
[root@localhost local]# tar -zxvf kibana-6.2.4-linux-x86_64.tar.gz
[root@localhost local]# vi config/kibana.yml
        elasticsearch.url: "http://0.0.0.0:9200"
        server.host: "0.0.0.0"
        kibana.index: ".kibana"
#启动kibana服务
[root@localhost local]# ./bin/kibana

#查看5601端口有没有启动
[root@localhost local]# ss -tnl
State       Recv-Q Send-Q              Local Address:Port                             Peer Address:Port
LISTEN      0      128                             *:22                                          *:*
LISTEN      0      100                     127.0.0.1:25                                          *:*
LISTEN      0      128                             *:5601                                        *:*
LISTEN      0      80                             :::3306                                       :::*
LISTEN      0      128                            :::9200                                       :::*
LISTEN      0      128                            :::9300                                       :::*
LISTEN      0      128                            :::22                                         :::*
LISTEN      0      100                           ::1:25                                         :::*
安装FileBeat
[root@localhost local]# wget https://artifacts.elastic.co/downloads/beats/filebeat/filebeat-6.2.4-linux-x86_64.tar.gz
[root@localhost local]# tar -zxvf filebeat-6.2.4-linux-x86_64.tar.gz
[root@localhost local]# vi filebeat.yml
        enabled: true
[root@localhost local]# ./filebeat -c filebeat.yml
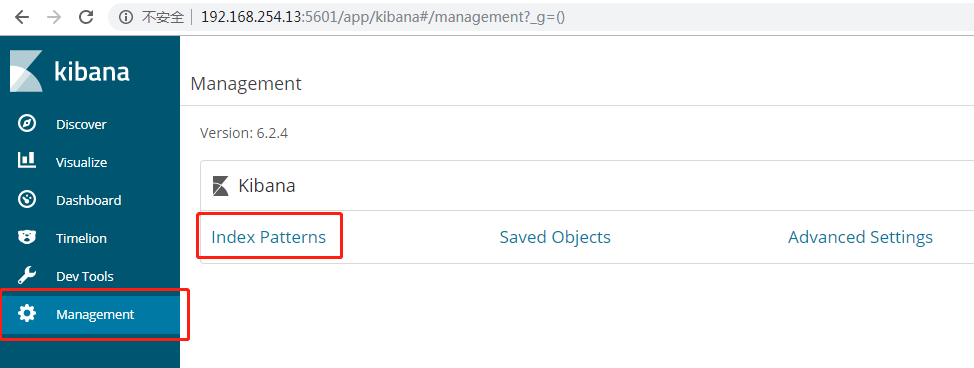
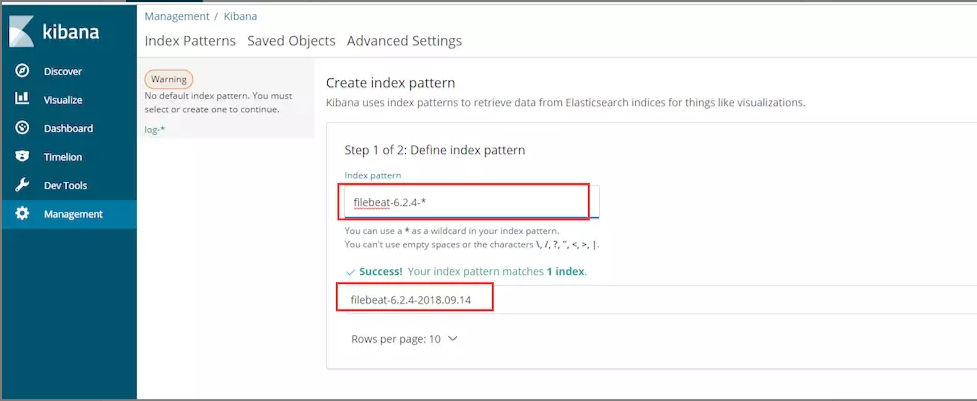
配置Kibana