Refer to R Tutorial andExercise Solution
It is a common requirement to efficiently estimate population parameters based on simple random sample data.
基于简单随机样本来estimate全局参数, 由于是预估, 一般是预估一个区间, 所以称为区间预估.
Point Estimate of Population Mean, 全局平均值的点估计
For any particular random sample, we can always compute its sample mean.
> library(MASS) # load the MASS package
> height.survey = survey$Height> mean(height.survey, na.rm=TRUE) # skip missing values
[1] 172.38
直接用样本mean来作为全局mean, 显然这个方法比较简陋
Interval Estimate of Population Mean with Known Variance, 已知全局方差的全局平均值的区间预估
Here, we discuss the case where the population variance σ2 is assumed known.
Let us denote the 100(1 −α∕2) percentile of the standard normal distribution as zα∕2. For random sample of sufficiently large size, the end points of the interval estimate at (1 − α) confidence level is given as follows:

这个就比直接用样本平均值高级点, 虽然我不知道为什么是这样来用全局方差
Assume the population standard deviation σ of the student height in survey is 9.48. Find the margin of error and interval estimate at 95% confidence level(1 − α).
> library(MASS) # load the MASS package
> height.response = na.omit(survey$Height)> n = length(height.response)
> sigma = 9.48 # population standard deviation
> sem = sigma/sqrt(n); sem # standard error of the mean
[1] 0.65575> E = qnorm(.975)∗sem; E # margin of error
[1] 1.2852> xbar = mean(height.response) # sample mean
> xbar + c(−E, E)
[1] 171.10 173.67
Interval Estimate of Population Mean with Unknown Variance, 未知全局方差的全局平均值的区间预估
Here, we discuss the case where the population variance is not assumed.
Let us denote the 100(1 −α∕2) percentile of the Student t distribution with n− 1 degrees of freedom as tα∕2. For random samples of sufficiently large size, and with standard deviation s, the end points of the interval estimate at (1 −α) confidence level is given as follows:

不知道全局方差, 就通过样品标准偏差(samples standard deviation)来替代全局方差进行预估, 更牛比了点
Without assuming the population standard deviation of the student height in survey, find the margin of error and interval estimate at 95% confidence level.
> n = length(height.response)
> s = sd(height.response) # sample standard deviation
> SE = s/sqrt(n); SE # standard error estimate
[1] 0.68117> E = qt(.975, df=n−1)∗SE; E # margin of error
[1] 1.3429
Sampling Size of Population Mean, 样本数量
The quality of a sample survey can be improved by increasing the sample size. The formula below provide the sample size needed under the requirement of population mean interval estimate at (1 −α) confidence level, margin of error E, and population variance σ2. Here, zα∕2 is the 100(1 − α∕2) percentile of the standard normal distribution.

样本越大当然预测就越准, 这个公式就是来算合适的样本size的
Assume the population standard deviation σ of the student height in survey is 9.48. Find the sample size needed to achieve a 1.2 centimeters margin of error at 95% confidence level.
> zstar = qnorm(.975)
> sigma = 9.48
> E = 1.2
> zstar^2 ∗ sigma^2/ E^2
[1] 239.75
Point Estimate of Population Proportion, 全局比例的点预估
Multiple choice questionnaires in a survey are often used to determine the the proportion of a population with certain characteristic. For example, we can estimate the proportion of female students in the university based on the result in the sample data set survey.
Find a point estimate of the female student proportion from survey.
> library(MASS) # load the MASS package
> gender.response = na.omit(survey$Sex)
> n = length(gender.response) # valid responses count> k = sum(gender.response == "Female")
> pbar = k/n; pbar
[1] 0.5
Interval Estimate of Population Proportion
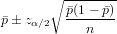
After we found a point sample estimate of the population proportion, we would need to estimate its confidence interval.
Let us denote the 100(1 −α∕2) percentile of the standard normal distribution as zα∕2. If the samples size n and population proportion p satisfy the condition that np ≥ 5 and n(1 − p) ≥ 5, than the end points of the interval estimate at (1 − α) confidence level is defined in terms of the sample proportion as follows.
Sampling Size of Population Proportion
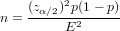
The quality of a sample survey can be improved by increasing the sample size. The formula below provide the sample size needed under the requirement of population proportion interval estimate at (1 − α) confidence level, margin of error E, and planned proportion estimate p. Here, zα∕2 is the 100(1 − α∕2) percentile of the standard normal distribution.