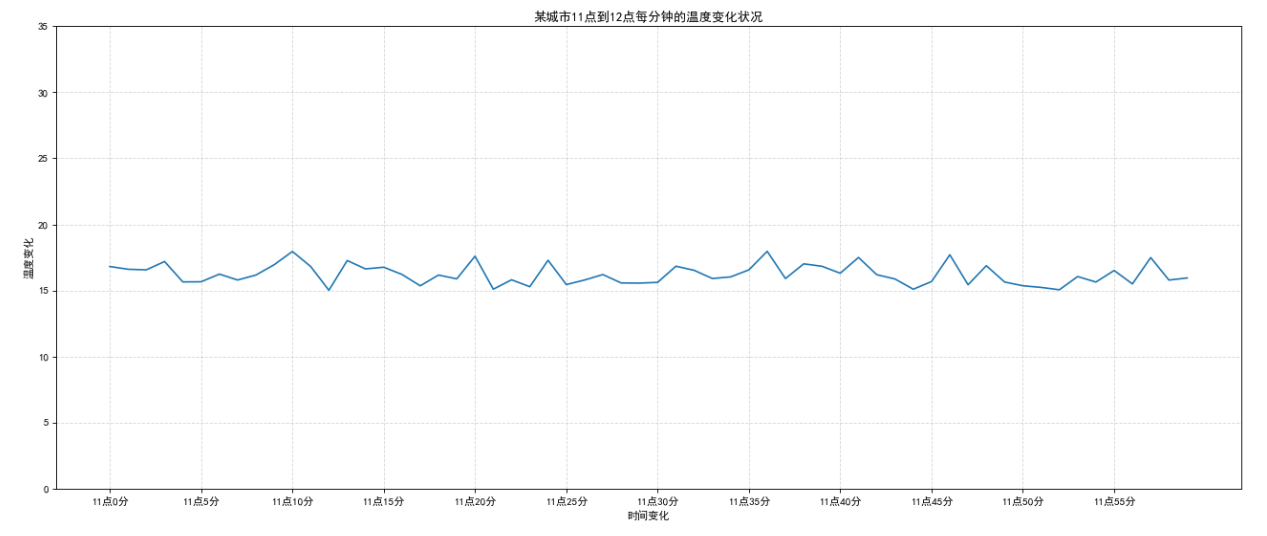
运行如下代码;
# 需求:画出某城市11点到12点1小时内每分钟的温度变化折线图,温度范围在15度~18度
import random
import matplotlib.pyplot as plt
# 1、准备数据 x y
x = range(60)
y_shanghai = [random.uniform(15, 18) for i in x]

# 2、创建画布
plt.figure(figsize=(20, 8), dpi=80)

# 3、绘制图像
plt.plot(x, y_shanghai)

# 修改x、y刻度
# 准备x的刻度说明
x_label = ["11点{}分".format(i) for i in x]
plt.xticks(x[::5], x_label[::5])
plt.yticks(range(0, 40, 5))

# 添加网格显示
plt.grid(linestyle="--", alpha=0.5)

# 添加描述信息
plt.xlabel("时间变化")
plt.ylabel("温度变化")
plt.title("某城市11点到12点每分钟的温度变化状况")

# 4、显示图
plt.show()
出现结果如下:
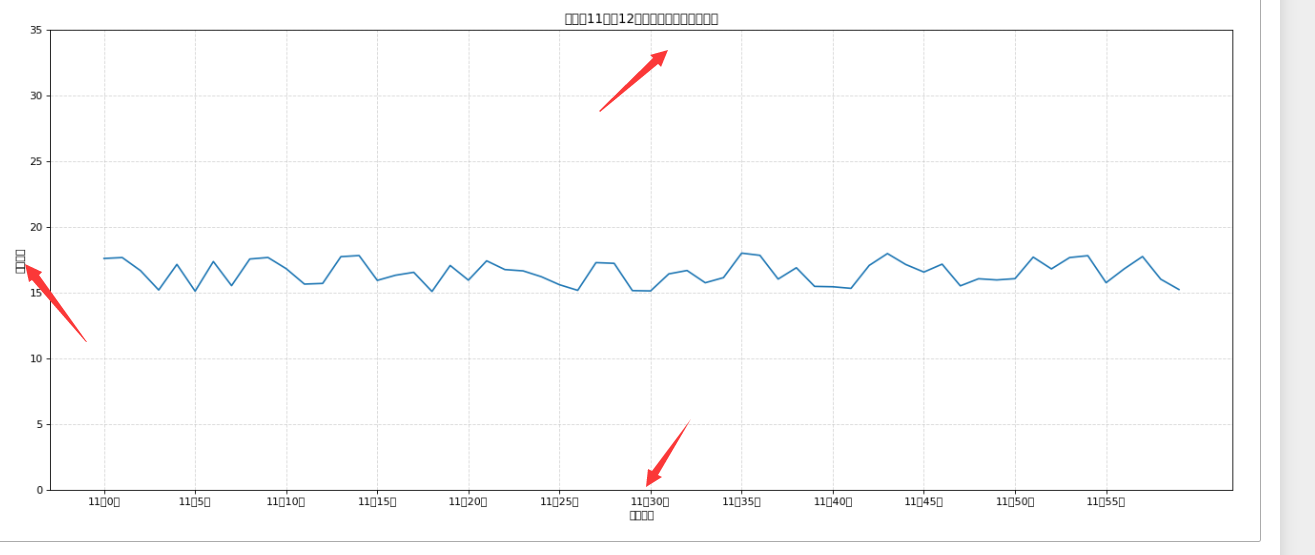
很明显出现了中文乱码:
网上很多都是修改配置文件清理缓存等等,
这里其实很简单加一行代码:
plt.rcParams['font.family'] = 'SimHei'

修改后的运行结果如下: