▶ k 近邻法来分类,用到了 kd 树的建立和搜索
● 代码
  1 import numpy as np
  2 import matplotlib.pyplot as plt
  3 from mpl_toolkits.mplot3d import Axes3D
  4 from mpl_toolkits.mplot3d.art3d import Poly3DCollection
  5 from matplotlib.patches import Rectangle
  6 import operator
  7 import warnings
  8
  9 warnings.filterwarnings("ignore")
 10 dataSize = 10000
 11 trainRatio = 0.3
 12
 13 def dataSplit(x, y, part):                                                          # 将数据集按给定索引分为两段
 14     return x[:part], y[:part],x[part:],y[part:]
 15
 16 def myColor(x):                                                                     # 颜色函数,用于对散点染色
 17     r = np.select([x < 1/2, x < 3/4, x <= 1, True],[0, 4 * x - 2, 1, 0])
 18     g = np.select([x < 1/4, x < 3/4, x <= 1, True],[4 * x, 1, 4 - 4 * x, 0])
 19     b = np.select([x < 1/4, x < 1/2, x <= 1, True],[1, 2 - 4 * x, 0, 0])
 20     return [r**2,g**2,b**2]
 21
 22 def mold(x, y):                                                                     # 距离采用欧氏距离的平方
 23     return np.sum((x - y)**2)
 24
 25 def createData(dim, kind, count = dataSize):                                        # 创建数据集
 26     np.random.seed(103)
 27     X = np.random.rand(count, dim)
 28     center = np.random.rand(kind, dim)
 29     Y = [ chr(65 + np.argmin(np.sum((X[i] - center)**2, 1))) for i in range(count) ]
 30     #print(output)
 31     classCount = dict([ [chr(65 + i),0] for i in range(kind) ])
 32     for i in range(count):
 33         classCount[Y[i]] +=1
 34     print("dim = %d, kind = %d, dataSize = %d,"%(dim, kind, count))
 35     for i in range(kind):
 36         print("kind %c -> %4d"%(chr(65+i), classCount[chr(65+i)]))
 37     return X, np.array(Y)
 38
 39 def buildKdTree(dataX, dataY, dividDim):                            # 建立 kd 树,每个节点具有的成员有:
 40     count, dim = np.shape(dataX)                                    # count 总结点数,dividDim 根节点用来划分空间的坐标的序号
 41     if count == 0:                                                  # point 根节点坐标,kind 根节点类别
 42         return {'count': 0}                                         # leftChild rightChild 左右子节点
 43     if count == 1:
 44         return {'count': 1, 'point': dataX[0], 'kind': dataY[0]}    # 总结点只有 0 或者 1 时只有部分成员就够了
 45
 46     #print(count)                                                    # 调试用,显示当前节点情况
 47     index = np.lexsort((np.ones(count),dataX[:,dividDim]))          # 用 dataX 的值大小来给 dataX 和 dataY 排序,以便查找中位数、切割数据
 48     childDataX = dataX[index]
 49     childDataY = dataY[index]
 50     return {'count': count, 'index': dividDim, 'point': childDataX[count>>1], 'kind': dataY[count>>1],
 51             'leftChild': buildKdTree(childDataX[:count>>1], childDataY[:count>>1], (dividDim + 1) % dim),
 52             'rightChild': buildKdTree(childDataX[(count>>1) + 1:], childDataY[(count>>1) + 1:], (dividDim + 1) % dim)}
 53
 54 def findNearest(origin, nowTree, dividDim):                         # 搜索 kd 树,寻找最近邻点
 55     if nowTree['count'] == 0:                                       # 空子树,返回一个极大的距离
 56         return np.inf, '?'
 57     if nowTree['count'] == 1:                                       # 单点子树,返回距离和类别
 58         return mold(origin, nowTree['point']), nowTree['kind']
 59
 60     dim = len(origin)
 61     moldCenter = mold(origin, nowTree['point'])                                 # 母节点距离
 62
 63     if origin[dividDim] < nowTree['point'][dividDim]:                           # 左支
 64         temp = findNearest(origin, nowTree['leftChild'], (dividDim+1)%dim)
 65         if origin[dividDim] + temp[0] > nowTree['point'][dividDim]:             # 穿透分界线,要算右边,最近点为母节点或新子节点
 66             temp = findNearest(origin, nowTree['rightChild'], (dividDim+1)%dim) # 没穿分界线,不算右边,最近点在母节点或旧子节点
 67     else:                                                                       # 右支
 68         temp = findNearest(origin, nowTree['rightChild'], (dividDim+1)%dim)
 69         if origin[dividDim] - temp[0] < nowTree['point'][dividDim]:             # 穿透分界线,要算左边
 70             temp = findNearest(origin, nowTree['leftChild'], (dividDim+1)%dim)  # 没穿分界线,不算左边
 71
 72     if moldCenter < temp[0]:                                                    # 所有分支的比较集中在母节点和挑出来的子节点之间
 73         return moldCenter, nowTree['kind']
 74     else:
 75         return temp
 76
 77 def vote(point, k, trainX, trainY):                                             # 计算所有距离,选取
 78     distance = np.sum((point - trainX)**2, 1)                                   # 计算
 79     queue = sorted(list(zip(distance[:k], trainY[:k])))                         # 取出前 k 项排好序
 80     for j in range(k, len(distance)):
 81         if distance[j] < queue[-1][0]:                                          # 每次有更优的点就把 queue 中最差的点替换掉,然后排序
 82             queue[-1] = (distance[j], trainY[j])
 83             queue.sort()
 84     kindCount = {}                                                              # 投票阶段
 85     for line in queue:
 86         if line[1] not in kindCount.keys():
 87             kindCount[line[1]] = 0
 88         kindCount[line[1]] += 1
 89     output = sorted(kindCount.items(),key = operator.itemgetter(1),reverse = True)
 90     return output[0][0]
 91
 92 def test(dim, kind, k):
 93     allX, allY = createData(dim, kind)
 94     trainX, trainY, testX, testY = dataSplit(allX, allY, int(dataSize * trainRatio))
 95     myResult = np.array([ '?' for i in range(len(testX)) ])         # 存放测试结果
 96
 97     if k == 1:                                                      # 一个最近邻时使用 kd 树,否则用正常的的计算距离排序
 98         tree = buildKdTree(trainX, trainY, 0)
 99         for i in range(len(testX)):                                 # 每次循环解决一个测试样本
100             myResult[i] = findNearest(testX[i], tree, 0)[1]
101     else:
102         if k > len(testX):
103             return None
104         for i in range(len(testX)):                                 # 每次循环解决一个测试样本
105             myResult[i] = vote(testX[i], k, trainX, trainY)
106
107     errorRatio = np.sum((myResult != np.array(testY)).astype(int)**2) / (dataSize * (1 - trainRatio))
108     print("k = %d, errorRatio = %4f
"%(k, errorRatio))
109     if dim >= 4:                                                    # 4维以上不画图,只输出测试错误率
110         return
111
112     errorP = []                                                     # 分类错误的点
113     classP = [ [] for i in range(kind) ]                            # 正确分到各类的的点
114     for i in range(len(testX)):
115         if myResult[i] != testY[i]:
116             errorP.append(testX[i])
117         else:
118             classP[ord(myResult[i]) - 65].append(testX[i])
119     errorP = np.array(errorP)
120     classP = [ np.array(classP[i]) for i in range(kind) ]
121
122     fig = plt.figure(figsize=(10, 8))
123
124     if dim == 1:                                                    # 分不同属性维度画图
125         plt.xlim(-0.1, 1.1)
126         plt.ylim(-0.1, 1.1)
127         for i in range(kind):
128             plt.scatter(classP[i][:,0], np.ones(len(classP[i]))*i, color = myColor(i/kind), s = 8, label = "class" + str(i))
129         if len(errorP) != 0:
130             plt.scatter(errorP[:,0], (errorP[:,0] > 0.5).astype(int), color = myColor(1), s = 16, label = "errorData")
131         R = [ Rectangle((0,0),0,0, color = myColor(i/kind)) for i in range(kind) ] + [ Rectangle((0,0),0,0, color = myColor(1)) ]
132         plt.legend(R, [ "class" + chr(i+65) for i in range(kind) ] + ["errorData"], loc=[0.84, 0.012], ncol=1, numpoints=1, framealpha = 1)
133
134     if dim == 2:
135         plt.xlim(-0.1, 1.1)
136         plt.ylim(-0.1, 1.1)
137         for i in range(kind):
138             plt.scatter(classP[i][:,0], classP[i][:,1], color = myColor(i/kind), s = 8, label = "class" + str(i))
139         if len(errorP) != 0:
140             plt.scatter(errorP[:,0], errorP[:,1], color = myColor(1), s = 16, label = "errorData")
141         R = [ Rectangle((0,0),0,0, color = myColor(i/kind)) for i in range(kind) ] + [ Rectangle((0,0),0,0, color = myColor(1)) ]
142         plt.legend(R, [ "class" + chr(i+65) for i in range(kind) ] + ["errorData"], loc=[0.84, 0.012], ncol=1, numpoints=1, framealpha = 1)
143
144     if dim == 3:
145         ax = Axes3D(fig)
146         ax.set_xlim3d(-0.1, 1.1)
147         ax.set_ylim3d(-0.1, 1.1)
148         ax.set_zlim3d(-0.1, 1.1)
149         ax.set_xlabel('X', fontdict={'size': 15, 'color': 'k'})
150         ax.set_ylabel('Y', fontdict={'size': 15, 'color': 'k'})
151         ax.set_zlabel('Z', fontdict={'size': 15, 'color': 'k'})
152         for i in range(kind):
153             ax.scatter(classP[i][:,0], classP[i][:,1],classP[i][:,2], color = myColor(i/kind), s = 8, label = "class" + str(i))
154         if len(errorP) != 0:
155             ax.scatter(errorP[:,0], errorP[:,1],errorP[:,2], color = myColor(1), s = 16, label = "errorData")
156         R = [ Rectangle((0,0),0,0, color = myColor(i/kind)) for i in range(kind) ] + [ Rectangle((0,0),0,0, color = myColor(1)) ]
157         plt.legend(R, [ "class" + chr(i+65) for i in range(kind) ] + ["errorData"], loc=[0.85, 0.02], ncol=1, numpoints=1, framealpha = 1)
158
159     fig.savefig("R:\dim" + str(dim) + "kind" + str(kind) + "k" + str(k) +".png")
160     plt.close()
161
162 if __name__ == '__main__':
163     test(2, 2, 1)
164     test(2, 3, 1)
165     test(3, 3, 1)
166     test(4, 3, 1)
167     test(2, 3, 2)
168     test(2, 4, 3)
169     test(3, 3, 2)
170     test(3, 4, 3)
171     test(4, 3, 2)
172     test(4, 4, 4)
● 输出结果
dim = 2, kind = 2, dataSize = 10000,
kind A -> 5301
kind B -> 4699
k = 1, errorRatio = 0.011143

dim = 2, kind = 3, dataSize = 10000,
kind A -> 2740
kind B -> 3197
kind C -> 4063
k = 1, errorRatio = 0.024714

dim = 3, kind = 3, dataSize = 10000,
kind A -> 3693
kind B -> 4232
kind C -> 2075
k = 1, errorRatio = 0.052571

dim = 4, kind = 3, dataSize = 10000,
kind A -> 2640
kind B -> 1765
kind C -> 5595
k = 1, errorRatio = 0.121000

dim = 2, kind = 3, dataSize = 10000,
kind A -> 2740
kind B -> 3197
kind C -> 4063
k = 2, errorRatio = 0.009857

dim = 2, kind = 4, dataSize = 10000,
kind A -> 2740
kind B -> 3000
kind C -> 2387
kind D -> 1873
k = 3, errorRatio = 0.013571

dim = 3, kind = 3, dataSize = 10000,
kind A -> 3693
kind B -> 4232
kind C -> 2075
k = 2, errorRatio = 0.028571

dim = 3, kind = 4, dataSize = 10000,
kind A -> 3029
kind B -> 3379
kind C ->  917
kind D -> 2675
k = 3, errorRatio = 0.038000

dim = 4, kind = 3, dataSize = 10000,
kind A -> 2640
kind B -> 1765
kind C -> 5595
k = 2, errorRatio = 0.062286

dim = 4, kind = 4, dataSize = 10000,
kind A -> 2472
kind B -> 1752
kind C -> 3365
kind D -> 2411
k = 4, errorRatio = 0.079429
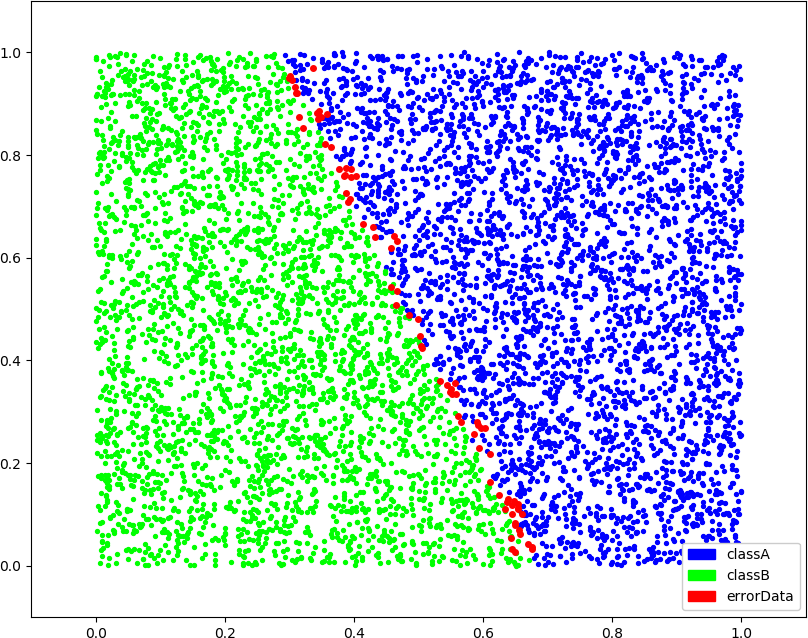
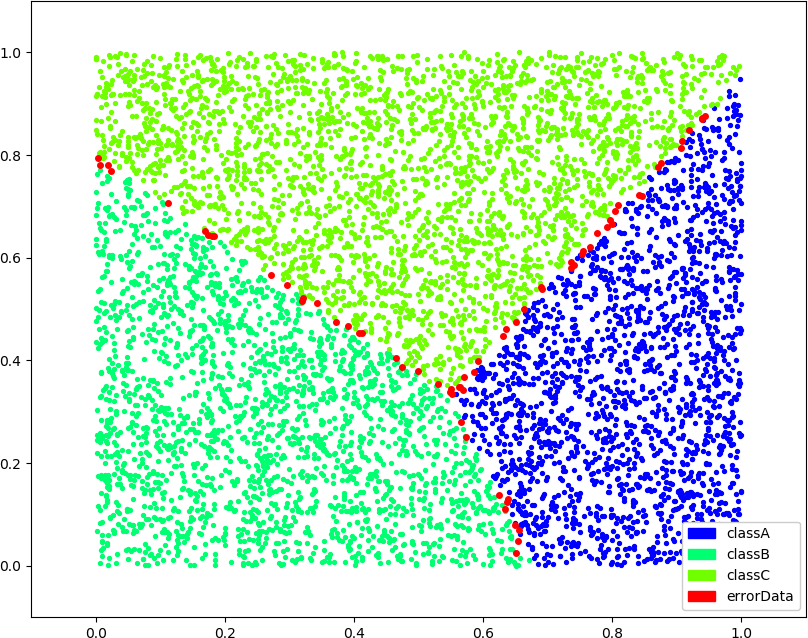
● 画图(2,2,1),(2,3,1),(2,3,2),(2,4,3),k 增大以后误分类的点明显减少了,k 为 1 时不知道为什么有几个中央点还分错了,可能搜索部分的代码上还有点问题


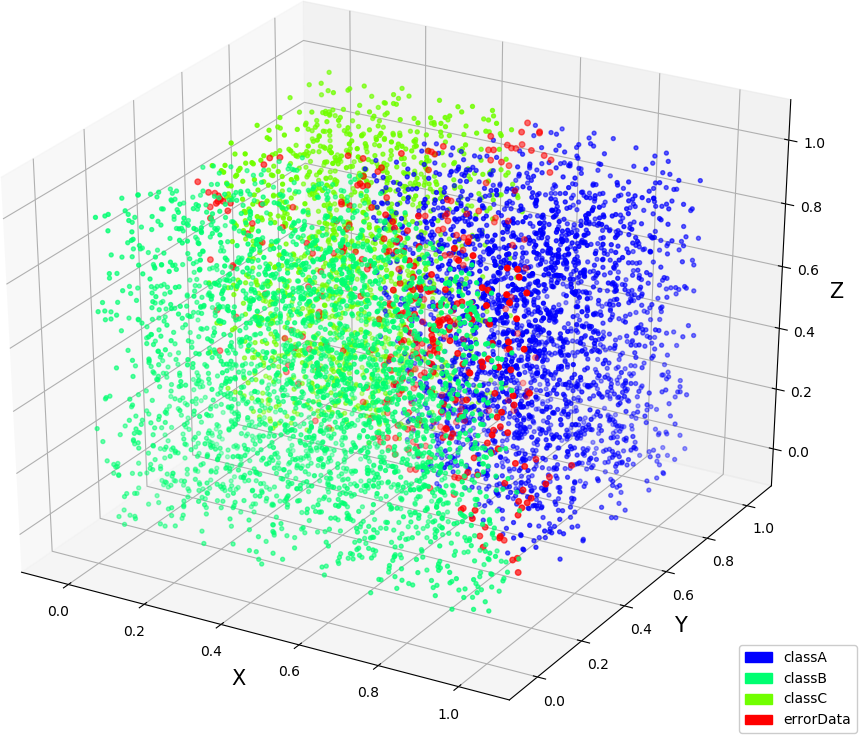
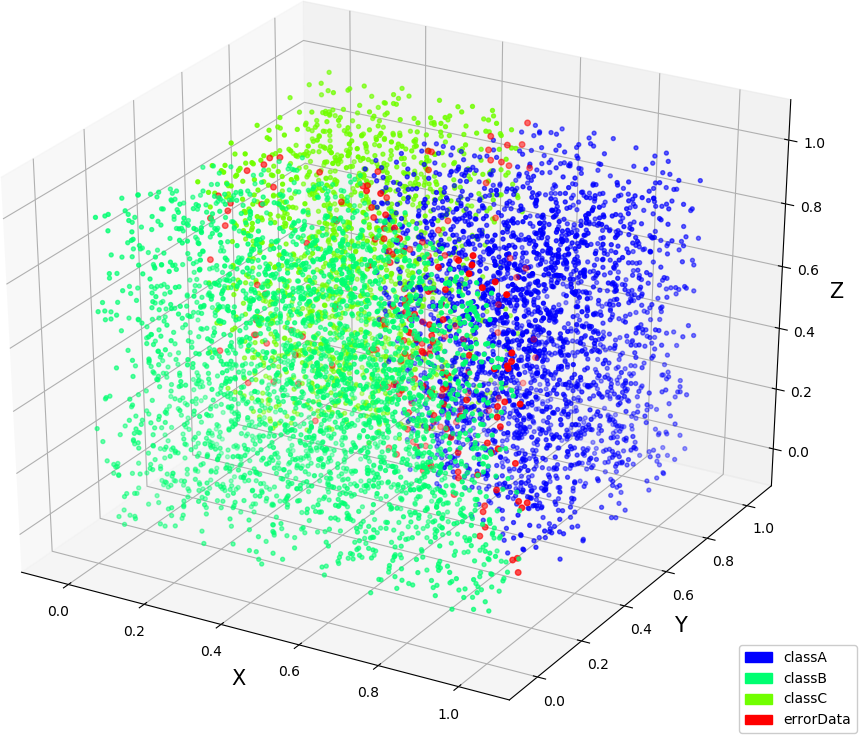
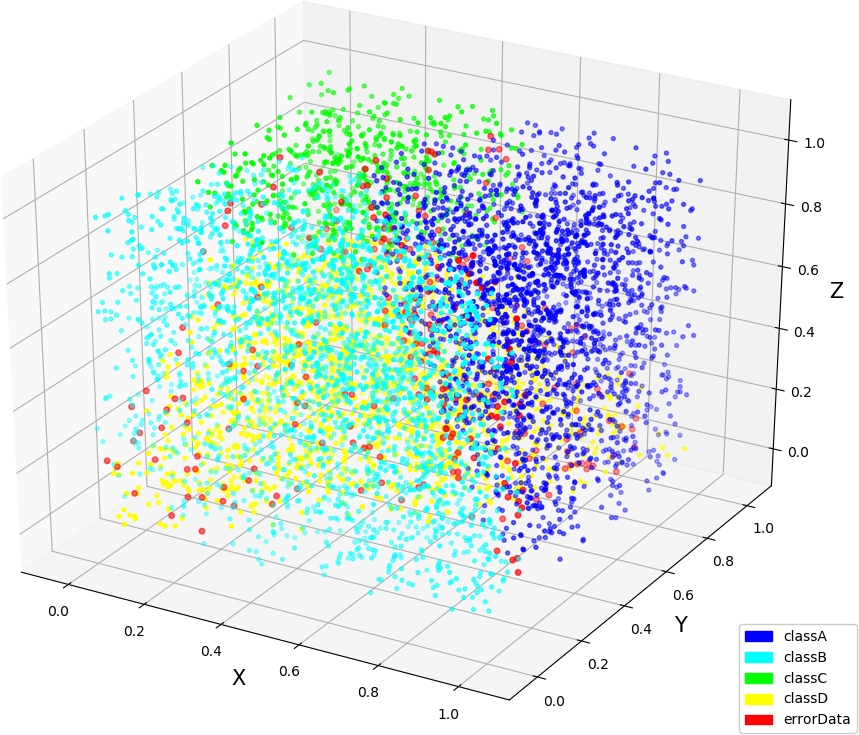
● 画图(3,3,1),(3,3,2),(3,4,3)
● kd 树的画图,跟决策树在生成算法上差不多
 1 import numpy as np
 2 import matplotlib.pyplot as plt
 3 import warnings
 4
 5 warnings.filterwarnings("ignore")
 6 dataSize = 300
 7
 8 def myColor(x):                                                                     # 颜色函数,用于对散点染色
 9     r = np.select([x < 1/2, x < 3/4, x <= 1, True],[0, 4 * x - 2, 1, 0])
10     g = np.select([x < 1/4, x < 3/4, x <= 1, True],[4 * x, 1, 4 - 4 * x, 0])
11     b = np.select([x < 1/4, x < 1/2, x <= 1, True],[1, 2 - 4 * x, 0, 0])
12     return [r**2,g**2,b**2]
13
14 def createData(dim, kind, count = dataSize):                                        # 创建数据集
15     np.random.seed(103)
16     X = np.random.rand(count, dim)
17     Y = [ chr(65 + int(X[i,1] > X[i,0] * (32 / 3 * (X[i,0] - 1) * (X[i,0] - 1/2) + 1))) for i in range(count) ]
18
19     #print(output)
20     classCount = dict([ [chr(65 + i),0] for i in range(kind) ])
21     for i in range(count):
22         classCount[Y[i]] +=1
23     print("dim = %d, kind = %d, dataSize = %d,"%(dim, kind, count))
24     for i in range(kind):
25         print("kind %c -> %4d"%(chr(65+i), classCount[chr(65+i)]))
26     return X, np.array(Y)
27
28 def buildKdTree(dataX, dataY, dividDim):                            # 建立 kd 树,每个节点具有的成员有:
29     count, dim = np.shape(dataX)                                    # count 总结点数,dividDim 根节点用来划分空间的坐标的序号
30     if count == 0:                                                  # point 根节点坐标,kind 根节点类别
31         return {'count': 0}                                         # leftChild rightChild 左右子节点
32     if count == 1:
33         return {'count': 1, 'point': dataX[0], 'kind': dataY[0]}    # 总结点只有 0 或者 1 时只有部分成员就够了
34
35     index = np.lexsort((np.ones(count),dataX[:,dividDim]))          # 用 dataX 的值大小来给 dataX 和 dataY 排序,以便查找中位数、切割数据
36     childDataX = dataX[index]
37     childDataY = dataY[index]
38     return {'count': count, 'index': dividDim, 'point': childDataX[count>>1], 'kind': dataY[count>>1],
39             'leftChild': buildKdTree(childDataX[:count>>1], childDataY[:count>>1], (dividDim + 1) % dim),
40             'rightChild': buildKdTree(childDataX[(count>>1) + 1:], childDataY[(count>>1) + 1:], (dividDim + 1) % dim)}
41
42 def draw(xMin, xMax, yMin, yMax, nowTree,kindType):
43     if(nowTree['count']) == 0:
44         return
45     if(nowTree['count']) == 1:
46         plt.text((xMin+xMax)/2,(yMin+yMax)/2, str(nowTree['kind']), size = 9, ha="center", va="center", bbox=dict(boxstyle="round", ec=(1., 0.5, 0.5), fc=(1., 1., 1.)))
47         return
48     if(nowTree['index']) == 0:                                                     # 画竖线
49         value = nowTree['point'][0]
50         plt.plot([value,value],[yMin,yMax],color=[0,0,0])
51         draw(xMin, value, yMin, yMax, nowTree['leftChild'], kindType)
52         draw(value, xMax, yMin, yMax, nowTree['rightChild'], kindType)
53     else:                                                                          # 画横线
54         value = nowTree['point'][1]
55         plt.plot([xMin,xMax],[value,value],color=[0,0,0])
56         draw(xMin, xMax, yMin, value, nowTree['leftChild'], kindType)
57         draw(xMin, xMax, value, yMax, nowTree['rightChild'], kindType)
58
59 def test(dim, kind, k):
60     testX, testY = createData(dim, kind)
61
62     tree = buildKdTree(testX, testY, 0)
63
64     plt.xlim(0.0,1.0)
65     plt.ylim(-0.0,1.0)
66     xT = []
67     xF = []
68     yT = []
69     yF = []
70     for i in range(len(testX)):
71         if testY[i] == 'A':
72             xT.append(testX[i,0])
73             yT.append(testX[i,1])
74         else:
75             xF.append(testX[i,0])
76             yF.append(testX[i,1])
77     fig = plt.figure(figsize=(10, 8))
78     plt.scatter(xT,yT,color=[1,0,0],label = "classA")
79     plt.scatter(xF,yF,color=[0,0,1],label = "classB")
80     plt.legend(loc=[0.87, 0.01], ncol=1, numpoints=1, framealpha = 1)
81     draw(0.0,1.0,0.0,1.0,tree,type(testY[0][-1]))
82     fig.savefig("R:\dim.png")
83     plt.close()
84
85 if __name__ == '__main__':
86     test(2, 2, 1)
● 输出图像
