一、概述
1、接下来介绍在k8s上运行pod对象时我们如何去监控我们系统级的资源指标以及业务级别的资源指标。数据如何获取和监控。在此之前先介绍一下Pod对象的资源请求和资源限制。即容器的资源需求和资源限制。在docker中说到过容器是可以资源限额的,在启动容器时候我们可以定义一个容器可以使用多少的cpu和内存资源。在当时说过cpu资源是可压缩资源,一个pod或一个容器在应该获取指定资源获取不到时等待即可,但是对内存来讲就不是这样的,假如他用到的资源不够就有可能会因为内存资源耗尽而被killd 。不过在我们k8s之上资源有两个维度限制,一个是定义其起始值,一个是定义其终结值。
a、requests:可以使用资源的requests来定义pod至少会用到多少CPU或内存资源。即资源需求,最低保障。
b、limits:即限额,也叫限制,也是硬限制。一般来讲我们的requests是小于等于limits的。
二、Pod资源限额
1、虽然这些限制是应用在容器之上的,我们一般会把其称之为Pod的资源需求或Pod的资源限制。配置之前先描述一下二者的不同指标。
a、CPU:在k8s上一个单位的cpu相当于我们对应的一颗虚拟CPU,一颗CPU是指一颗逻辑CPU,也就是指一个核心。或者是一个超线程。一个两核双线程的CPU其实是会被虚拟成4颗逻辑cpu。 1个cpu还能被单独划分成子单位。一个核心相当于1000个毫核心。也就是milicores。也即 500m=0.5CPU
b、内存:计量单位为E、P、T、G、M、K,一般而言我们以Ei,Pi...等为计量单位。
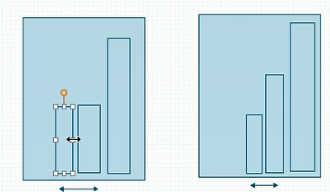
2、我们一般是这样划分CPU的资源指标占用量的。比如有一个区间是我们的CPU limit,假设我们现在一个pod中的某一容器最多只能使用0.5个cpu核心,那么我们就定义cpu.limits=500m,但是这500m是其硬上限。即多用是不可以的,不用的话是可以的。除此之外我们还有一个限制叫request,意思是我们要想运行这个容器至少得有多少个cpu才行。假如cpu.requests=200m,意思就是我们要想能够确保这个容器运行至少得给其0.2个cpu核心。这是他最低保障。并不是他上来真正会用这么多,而是说要确保被调度的目标节点上得有这么多空闲cpu可用。每一个节点已经有多少资源被分配出去了就是靠这个节点上所运行的所有容器的cpu的requests加起来。比如我们现在有4个容器,每个容器至少需要0.5核我们cpu只有四核则意味着还有2核空闲,因此我们随后调度时如果一个pod中的容器要求至少要使用3个cpu那么在第一次预选时就被淘汰了,因为他无法在节点资源级满足这个对应的容器的需要。所以我们去计算一个pod中的容器需要多少资源时是靠这个requests作为他的需求量的。cpu.limits叫最大保证,如果我们系统资源无法保证你能用500m,但是至少要确保要有cpu.requests中定义的200m这么多的资源可用。所以我们说cpu.requests对我们系统调度来说是非常重要的。

3、接下来我们简单创建一个pod看看定义他的资源需求以后他是怎么运行的。我们定义资源需求他只定义了资源的请求下限。我们明确说他至少要有200m,但很有可能系统上有4个cpu核心,而这个应用程序因为bug或其它原因把这四核全吃了也是有可能的。因此我们一般而言要把需求和上限要同时使用,不然其有可能会吃掉节点所有资源。所以我们这两个维度的限制作用各不相同。requests需求用于确保我们在调度时以确保对应节点上要拥有这么多资源满足这个pod运行的某些功能时的基本需求。而limits则用于限制这个容器无论怎么运行绝对不能超过的资源阈值。
a、首先我们来看其定义方式。可以看到对应的使用方式我们可以在explain的连接中查看
[root@k8smaster ~]# kubectl explain pods.spec.containers.resources
KIND:     Pod
VERSION:  v1

RESOURCE: resources <Object>

DESCRIPTION:
     Compute Resources required by this container. Cannot be updated. More info:
     https://kubernetes.io/docs/concepts/storage/persistent-volumes#resources

     ResourceRequirements describes the compute resource requirements.

FIELDS:
   limits    <map[string]string>
     Limits describes the maximum amount of compute resources allowed. More
     info:
     https://kubernetes.io/docs/concepts/configuration/manage-compute-resources-container/

   requests    <map[string]string>
     Requests describes the minimum amount of compute resources required. If
     Requests is omitted for a container, it defaults to Limits if that is
     explicitly specified, otherwise to an implementation-defined value. More
     info:
     https://kubernetes.io/docs/concepts/configuration/manage-compute-resources-container/
b、首先我们去除前面打的污点然后再创建pod
[root@k8smaster metrics]# kubectl taint node k8snode1 node-type-
node/k8snode1 untainted
[root@k8smaster metrics]# kubectl taint node k8snode2 node-type-
node/k8snode2 untainted
[root@k8smaster metrics]# cat pod-demo.yaml
apiVersion: v1
kind: Pod
metadata:
  name: pod-demo
  namespace: default
  labels: #也可以在此处写上{app:myapp,tier:frontend}代替下面两行
    app: myapp #应用层级标签
    tier: frontend #架构层级标签,在分层架构中属于frontend层
  annotations:
    wohaoshuai.com/created-by: "cluster admin"
spec:
  containers: #是一个列表,具体定义方式如下
  - name: myapp
    image: ikubernetes/stress-ng #压测用的容器
    command: ["/usr/bin/stress-ng","-m 1","-c 1","--metrics-brief"] #-m 1表示启动一个子进程对内存做压测,-c 1表示启动一个子进程对cpu做压测。--metrics-brief表示使用简洁的输出格式。
    resources:
      requests:
        cpu: "200m"
        memory: "128Mi"
      limits:
        cpu: "500m"
        memory: "200Mi"
[root@k8smaster metrics]# kubectl apply -f pod-demo.yaml
pod/pod-demo created
[root@k8smaster metrics]# kubectl get pods -o wide
NAME                            READY     STATUS    RESTARTS   AGE       IP            NODE
myapp-deploy-5d9c6985f5-46rtw   1/1       Running   0          3h        10.244.2.12   k8snode2
myapp-deploy-5d9c6985f5-7nhwq   1/1       Running   0          3h        10.244.1.9    k8snode1
myapp-deploy-5d9c6985f5-p8gsg   1/1       Running   0          3h        10.244.2.13   k8snode2
pod-demo                        1/1       Running   0          2m        10.244.2.14   k8snode2
c、b中的pod好像会压出问题,此处我们只压测cpu
[root@k8smaster metrics]# cat pod-demo.yaml
apiVersion: v1
kind: Pod
metadata:
  name: pod-demo
  namespace: default
  labels: #也可以在此处写上{app:myapp,tier:frontend}代替下面两行
    app: myapp #应用层级标签
    tier: frontend #架构层级标签,在分层架构中属于frontend层
  annotations:
    wohaoshuai.com/created-by: "cluster admin"
spec:
  containers: #是一个列表,具体定义方式如下
  - name: myapp
    image: ikubernetes/stress-ng #压测用的容器
    command: ["/usr/bin/stress-ng","-c 1","--metrics-brief"] #-c 1表示启动一个子进程对cpu做压测。--metrics-brief表示使用简洁的输出格式。
    resources:
      requests:
        cpu: "200m"
        memory: "128Mi"
      limits:
        cpu: "500m"
        memory: "512Mi"
[root@k8smaster metrics]# kubectl apply -f pod-demo.yaml
pod/pod-demo created
[root@k8smaster metrics]# kubectl get pods -o wide
NAME                            READY     STATUS    RESTARTS   AGE       IP            NODE
myapp-deploy-5d9c6985f5-46rtw   1/1       Running   0          3h        10.244.2.12   k8snode2
myapp-deploy-5d9c6985f5-7nhwq   1/1       Running   0          3h        10.244.1.9    k8snode1
myapp-deploy-5d9c6985f5-p8gsg   1/1       Running   0          3h        10.244.2.13   k8snode2
pod-demo                        1/1       Running   0          32s       10.244.2.15   k8snode2

[root@k8smaster ~]# kubectl exec -it pod-demo top #可以看到cpu用了25%,我们虚拟机cpu为2核,因为容器上限为500m因此使用率为25%
Mem: 1605360K used, 261688K free, 19624K shrd, 2108K buff, 1002740K cached
CPU:  26% usr   1% sys   0% nic  72% idle   0% io   0% irq   0% sirq
Load average: 2.16 1.32 0.89 4/393 12
  PID  PPID USER     STAT   VSZ %VSZ CPU %CPU COMMAND
    7     1 root     R     6884   0%   1  25% {stress-ng-cpu} /usr/bin/stress-ng -c 1 --metrics-brief
    1     0 root     S     6244   0%   1   0% /usr/bin/stress-ng -c 1 --metrics-brief
    8     0 root     R     1504   0%   0   0% top
d、requests是定义了能够被调度器作为基本衡量条件的调度值使用的,比如我们调度器他能根据requests属性定义的资源请求量来判定哪些节点能够接受这个pod去运行。对每一个节点来讲他们会把所有容器的资源需求量加起来作为已分配处理的配额。
4、需要说明的是容器中的可见资源量和他们的可用资源量不是一回事。我们限制了以后,比如使用limit限制资源限额,使用requests限制资源需求。使用free命令看到的应该是整个节点上的内存而不会仅仅是当前这个容器中的内存。那么这样会有问题,比如我在容器中运行一个jvm,jvm上的很多程序在跑起来怎么区分队列层呢?可能会使用默认节点可用内存的百分之多少的样子,如果我们在容器中看到的内存可用量不是对应的容器的最大限额而是节点的内存量这儿可能就有点麻烦,计算结果有可能吞掉整个容器内存都不够。所以我们说目前来讲在容器的资源限制方面在这个维度上还是存在一些问题的。另外,我们每创建一个pod以后我们去describe这个pod可以看到我们pod有个QoS Class(服务质量类别)。因此我们在容器中限制了资源应用以后他会自动被分配一个叫QoS的。他会自动属于某个QoS类别。默认情况下QoS类别有三个:
a、Guranteed:保证。即每个容器的cpu资源设置了相同值的requests和limit属性。即cpu的资源需求量,内存资源需求量两边都定义了,并且requests都等于limits。即同时设置了CPU和内存的requests和limits,最重要的是要满足 cpu.limits=cpu.requests同理memory.limits=memory.requests。这类pod就具有最高优先级,即我们现在有很多Pod需要运行的时候假如节点资源不够无法满足所有的pod的容器去运行这类容器是要被优先运行的。因为他的优先级最高。而但凡这样做了属性设置的会被自动归类为Guranteed类别。
b、Burstable:至少有一个容器设置了cpu或内存资源的requests属性。其定义了requests但是可能没有定义limit之类的。因此这一类就具有中等优先级。我们刚刚设置了内存的requests也设置了cpu的requests,但是内存和cpu的requests和其limit是不相等的。因此其被自动归类为Burstable。
[root@k8smaster metrics]# cat pod-demo.yaml
apiVersion: v1
kind: Pod
metadata:
  name: pod-demo
  namespace: default
  labels: #也可以在此处写上{app:myapp,tier:frontend}代替下面两行
    app: myapp #应用层级标签
    tier: frontend #架构层级标签,在分层架构中属于frontend层
  annotations:
    wohaoshuai.com/created-by: "cluster admin"
spec:
  containers: #是一个列表,具体定义方式如下
  - name: myapp
    image: ikubernetes/myapp:v1
    resources:
      requests:
        cpu: "200m"
        memory: "512Mi"
      limits:
        cpu: "200m"
        memory: "512Mi"
[root@k8smaster metrics]# kubectl apply -f pod-demo.yaml
pod/pod-demo created
[root@k8smaster metrics]# kubectl describe pods pod-demo |grep QoS
QoS Class:       Guaranteed
c、BestEffort:没有任何一个容器设置了requests或limits属性;最低优先级别
[root@k8smaster metrics]# kubectl get pods
NAME                            READY     STATUS    RESTARTS   AGE
myapp-deploy-5d9c6985f5-46rtw   1/1       Running   0          1d
myapp-deploy-5d9c6985f5-7nhwq   1/1       Running   0          1d
myapp-deploy-5d9c6985f5-p8gsg   1/1       Running   0          1d
pod-demo                        1/1       Running   0          10m

[root@k8smaster metrics]# kubectl describe pod myapp-deploy-5d9c6985f5-46rtw |grep QoS
QoS Class:       BestEffort
5、需要注意的是当内存资源紧缺时,即资源不够用时BestEffort中的容器会被优先终止以腾出资源确保其它两种类型的pod中的容器能正常运行。如果一个节点上只有Guranteed和Burstable类型的容器资源不够用时又会杀优先级较低的Burstable。现在我们可能有很多pod中的容器都属于Burstable那么我们应该先杀哪个呢?因此他需要有一种计算标准去终止。其实在我们对应的k8s代码中有一段设置的是尽可能把他对应的requests资源已经占用量比例较大的给关掉。比如我们现在有两个pod,对第一个pod来讲他的内存的limits是1G,他的requests是512M,而现在已经占了500M了,已经满足基本最低需求了。对第二个pod来讲他需求2G,最低要求1G,现在已经占据512了。第一个pod占了500M,第二个占了512M,第二个基本保证是1G,第一个基本保证是512M,那么谁会被干掉呢?他是这样来评估的,就是谁已分配的量已经接近其需求量那么就认为说他其实没有空间了,马上就会被干掉了,所以第一个会被干掉。即已占用量与需求量的比例越大则优先被干掉,不管用了多少。
三、heapster
1、刚刚有个很尴尬的地方在于,我创建了这样的限制pod以后我想观察Pod到底占了多少资源呢?比如我们分配说limits是512M,requests是256M,我现在想看看到底用了多少要怎么看呢?我们可以用kubectl top,不过此时没法用,因为我们k8s集群top命令应用是依赖于集群上部署一个addons叫heapster,意思是说我们整个k8s需要一个运行在集群级别的各pod甚至是各节点资源用量的采集和存储工具。kubectl top这样的命令是根据采集和存储数据的机制而显示的。如果没有这样的heapster我们系统中的top是没法运行的,包括我们部署的dashboard中的某些资源用量的显示功能也是依赖于heapster的。简单来讲我们可以这样来理解,我们虽然在节点级我们曾经使用过top,stat,vmstat等命令能够统计节点级的进程使用资源。但是当k8s运行在众多节点以后每一个pod运行在哪儿都没法确定,这个pod进程中到底占了多少资源并且要用同一视图查看时是没法的,因为他只是在节点级。所以为了实现这样的功能我们就需要在整个集群上部署一个统一的资源指标收集和存储工具,至少我们要有一个收集功能。当我们需要看的时候他要联系到每一个节点上,通过每一个节点的agent来获取到这个节点之上的每一个进程甚至是节点本身的资源用量,而后用kubectl top命令来显示。但是我们系统默认没有部署此工具,他需要单独额外部署一套这样的工具,传统的k8s集群中默认建议使用的指标数据的采集和存储工具叫HeapSter,但是HeapSter只是一个汇聚指标数据的,因为每个节点上都要采集节点自身的和上面运行的pod的指标数据。这个数据收集完以后也只在节点级别有效。因此我们需要一个集中统一来收集并存储的工具。
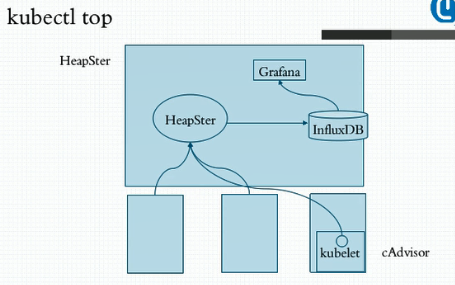
2、那么HeapSter是一套什么样的架构呢?首先在每个节点上我们运行了一个工具叫kubelet,这是作为集群的代理插件的一个非常重要的组件,kubelet其实是能够获取当前系统上由他所负责创建和管理的各种资源对象,尤其是Pod的相关信息数据,但是真正完整去采集节点级和pod的数据是kubelet中的有一个子组件也是kubelet的一个插件叫cAdvisor,早些时候cAdvisor是一个单独的组件,较新的版本中其已经是kubelet内建的一个功能了,即装上Kubelet就有了。他是专门负责收集当前节点上各pod上的各容器以及当前节点在节点级的各种系统级资源指标的占用量,比如节点级和pod级的cpu,内存和存储用量等信息。他可以去收集这些信息,收集完了后你可以在单节点查看,早些时候的版本是支持的,现在已经不支持了。因此kubelet中没有打开这个功能,默认情况下我们把kubelet的cAdvisor这个功能打开以后他会监听在默认叫做4194端口上。现在我们为了安全起见已经自动把这个功能给关掉了。他不需要用户主动连接他去采集数据,而是主动报告给 。我们的HeapSter是专门为我们的k8s集群上去收集由cAdvisor在每一个节点上采集的数据为统一的存储位的这么一个工具。所以我们在集群上托管运行一个pod,这个pod就叫HeapSter,而后各cAdvisor就能够向这个pod去主动发送报告其所采集到的数据。所以其是一个统一的各种指标数据的收集工具。收集完成后他可以缓存在内存中,但内存是有限的,所以他只能缓存一段时间的数据用于让我们的kubectl top查看。我想看历史上昨天,前天,以及趋势数据是怎么样的,发报告给HeapSter是没法做这个功能的,能做一段时间历史数据的缓存。因为他使用缓存系统来存储的。如果我们想要长期存储得靠另一个组件叫做influxDB,他是由HeapSter调用的外部的一个持续数据库存储系统。我们HeapSter采集了数据以后可以整合存储到其中。这样就能达到持久存储的目的。这样我们就能查看历史中的资源使用情况,不过我们需要借助于另外一个工具来查看,一个非常漂亮的图形界面的提供者Grafana。他可以将influxDB作为数据源。这样我们就能愉快的展示influxDB中曾经采集到的每一个pod甚至是每一个节点的相关数据的统计结果了。
3、一般而言pod的资源监控的大体行为可分为三类指标。
a、kubernetes系统指标
b、容器指标:指容器的cpu,内存,存储等资源利用状况
c、应用指标:即我们业务指标中的应用程序中的自身的一些指标数据。接收了多少用户请求,内部有多少个子进程大概在处理什么请求。
4、对k8s来讲,有几个核心的组件。有一个叫kube-dns默认就已经被装上去了。还有就是dashboard,现在就是另一个HeapSter。要想安装部署HeapSter就需要安装上面所述的三个组件:HeapSter,InfluxDB,Grafana。而这三个组件要想能够在系统级和整个集群级收集各名称空间中的pod资源的指标数据在RBAC强制已经启用的条件下他们还要定义RBAC的各种基于角色资源控制所需要依赖的资源授权才行。所以我们还应该使用他的rbac的一些资源特性。
三、部署HeapSter
1、部署InfluxDB。他是一个持续数据库系统,我们这儿直接部署并使用其功能即可,更何况我们有了k8s编排工具以后他所有的设置做好自动识别以后使用他的配置清单文件应用就可以直接生效了。但是要注意的是HeapSter和InfluxDB是有依赖关系的,InfluxDB将被HeapSter所依赖,因此HeapSter去访问InfluxDB他的访问端点是什么呢?正常情况下我们InfluxDB应该是一个服务器上运行的进程,访问时应该是InfluxDB监听了一个地址的一个端口。因此我们HeapSter应该通过这个地址的这个端口来访问他。现在我们如果把他们都托管到我们k8s集群上我们InfluxDB作为一个pod来讲:第一他的数据需不需要持久存储?如果需要持久存储我们需要给其提供一个有存储能力的存储卷。无论是nfs,glusterfs等等,不过默认情况下这个存储卷功能默认情况下并没有配置。所以你自己在生产环境中使用时并不能拿那个在线清单直接用,而是应该把清单下下来根据自己的存储卷的使用状态给其编辑修改好以后再运用。第二,如果InfluxDB如果自身down了会怎么样?他down了可能会被其控制器重建,重建以后IP肯定就变了,因此HeapSter访问他时不能直接使用其IP进行访问。而应该用service,并且也可以用servicename去访问。因此coredns还是被依赖。
a、部署链接为https://github.com/kubernetes-retired/heapster/blob/master/deploy/kube-config/influxdb/influxdb.yaml,我们先看看他的内容
apiVersion: extensions/v1beta1
kind: Deployment
metadata:
  name: monitoring-influxdb
  namespace: kube-system
spec:
  replicas: 1
  template:
    metadata:
      labels:
        task: monitoring
        k8s-app: influxdb
    spec:
      containers:
      - name: influxdb
        image: k8s.gcr.io/heapster-influxdb-amd64:v1.5.2
        volumeMounts:
        - mountPath: /data
          name: influxdb-storage
      volumes:
      - name: influxdb-storage
        emptyDir: {} #意味着这个pod删除后就废了,所以建议生产环境中要改为真正意义的具有持久存储功能的存储卷
---
apiVersion: v1
kind: Service
metadata:
  labels:
    task: monitoring
    # For use as a Cluster add-on (https://github.com/kubernetes/kubernetes/tree/master/cluster/addons)
    # If you are NOT using this as an addon, you should comment out this line.
    kubernetes.io/cluster-service: 'true'
    kubernetes.io/name: monitoring-influxdb
  name: monitoring-influxdb
  namespace: kube-system
spec:
  ports:
  - port: 8086
    targetPort: 8086
  selector:
    k8s-app: influxdb
b、当influxdb定义完以后他的service名称叫monitoring-influxdb,并且他被部署在kube-system名称空间,上面也是。然后监听在8086端口。所以我们前面的HeapSter访问他时应该使用monitoring-influxdb再加上namespace再加上svc.cluster.local这样的后缀来访问,当然也可以使用相对名称。此处我们部署时需要修改我们apiVersion
[root@k8smaster metrics]# cat influxdb.yaml
apiVersion: apps/v1
kind: Deployment
metadata:
  name: monitoring-influxdb
  namespace: kube-system
spec:
  replicas: 1
  selector:
    matchLabels:
      task: monitoring
      k8s-app: influxdb
  template:
    metadata:
      labels:
        task: monitoring
        k8s-app: influxdb
    spec:
      containers:
      - name: influxdb
        image: k8s.gcr.io/heapster-influxdb-amd64:v1.5.2
        volumeMounts:
        - mountPath: /data
          name: influxdb-storage
      volumes:
      - name: influxdb-storage
        emptyDir: {}
---
apiVersion: v1
kind: Service
metadata:
  labels:
    task: monitoring
    # For use as a Cluster add-on (https://github.com/kubernetes/kubernetes/tree/master/cluster/addons)
    # If you are NOT using this as an addon, you should comment out this line.
    kubernetes.io/cluster-service: 'true'
    kubernetes.io/name: monitoring-influxdb
  name: monitoring-influxdb
  namespace: kube-system
spec:
  ports:
  - port: 8086
    targetPort: 8086
  selector:
    k8s-app: influxdb
[root@k8smaster metrics]# kubectl apply -f influxdb.yaml
deployment.apps/monitoring-influxdb unchanged
service/monitoring-influxdb unchanged
c、此时我们可以看到相应的svc和pod以及pod的很多初始化信息
[root@k8smaster metrics]# kubectl get svc -n kube-system
NAME                   TYPE        CLUSTER-IP       EXTERNAL-IP   PORT(S)         AGE
kube-dns               ClusterIP   10.96.0.10       <none>        53/UDP,53/TCP   110d
kubernetes-dashboard   NodePort    10.109.237.216   <none>        443:31450/TCP   19d
monitoring-influxdb    ClusterIP   10.102.40.103    <none>        8086/TCP        1d
[root@k8smaster metrics]# kubectl get pods -n kube-system |grep influxdb
monitoring-influxdb-848b9b66f6-tjvz4   1/1       Running   0          1d
[root@k8smaster metrics]# kubectl logs monitoring-influxdb-848b9b66f6-tjvz4 -n kube-system
ts=2019-08-26T02:13:40.400423Z lvl=info msg="InfluxDB starting" log_id=0HUw2ih0000 version=unknown branch=unknown commit=unknown
ts=2019-08-26T02:13:40.400448Z lvl=info msg="Go runtime" log_id=0HUw2ih0000 version=go1.10.3 maxprocs=2
ts=2019-08-26T02:13:40.576298Z lvl=info msg="Using data dir" log_id=0HUw2ih0000 service=store path=/data/data
ts=2019-08-26T02:13:40.576409Z lvl=info msg="Open store (start)" log_id=0HUw2ih0000 service=store trace_id=0HUw2jO0000 op_name=tsdb_open op_event=start
ts=2019-08-26T02:13:40.576439Z lvl=info msg="Open store (end)" log_id=0HUw2ih0000 service=store trace_id=0HUw2jO0000 op_name=tsdb_open op_event=end op_elapsed=0.032ms
ts=2019-08-26T02:13:40.576457Z lvl=info msg="Opened service" log_id=0HUw2ih0000 service=subscriber
ts=2019-08-26T02:13:40.576461Z lvl=info msg="Starting monitor service" log_id=0HUw2ih0000 service=monitor
ts=2019-08-26T02:13:40.576464Z lvl=info msg="Registered diagnostics client" log_id=0HUw2ih0000 service=monitor name=build
ts=2019-08-26T02:13:40.576467Z lvl=info msg="Registered diagnostics client" log_id=0HUw2ih0000 service=monitor name=runtime
...
2、部署HeapSter
a、部署时需要依赖于rbac的设定。对应yaml连接为https://raw.githubusercontent.com/kubernetes-retired/heapster/master/deploy/kube-config/rbac/heapster-rbac.yaml
[root@k8smaster metrics]# cat heapster-rbac.yaml
kind: ClusterRoleBinding
apiVersion: rbac.authorization.k8s.io/v1beta1
metadata:
  name: heapster
roleRef:
  apiGroup: rbac.authorization.k8s.io
  kind: ClusterRole
  name: system:heapster
subjects:
- kind: ServiceAccount
  name: heapster
  namespace: kube-system
[root@k8smaster metrics]# kubectl apply -f heapster-rbac.yaml
clusterrolebinding.rbac.authorization.k8s.io/heapster created
b、部署HeapSter,对应yaml链接为https://raw.githubusercontent.com/kubernetes-retired/heapster/master/deploy/kube-config/influxdb/heapster.yaml。下载后做些许修改即可
[root@k8smaster metrics]# cat heapster.yaml
apiVersion: v1
kind: ServiceAccount
metadata:
  name: heapster
  namespace: kube-system
---
apiVersion: apps/v1
kind: Deployment
metadata:
  name: heapster
  namespace: kube-system
spec:
  replicas: 1
  selector:
    matchLabels:
      task: monitoring
      k8s-app: heapster
  template:
    metadata:
      labels:
        task: monitoring
        k8s-app: heapster
    spec:
      serviceAccountName: heapster
      containers:
      - name: heapster
        image: k8s.gcr.io/heapster-amd64:v1.5.4
        imagePullPolicy: IfNotPresent
        command:
        - /heapster
        - --source=kubernetes:https://kubernetes.default
        - --sink=influxdb:http://monitoring-influxdb.kube-system.svc:8086
---
apiVersion: v1
kind: Service
metadata:
  labels:
    task: monitoring
    # For use as a Cluster add-on (https://github.com/kubernetes/kubernetes/tree/master/cluster/addons)
    # If you are NOT using this as an addon, you should comment out this line.
    kubernetes.io/cluster-service: 'true'
    kubernetes.io/name: Heapster
  name: heapster
  namespace: kube-system
spec:
  ports:
  - port: 80
    targetPort: 8082
  type: NodePort
  selector:
    k8s-app: heapster
[root@k8smaster metrics]# kubectl apply -f heapster.yaml
serviceaccount/heapster created
deployment.apps/heapster created
service/heapster created
[root@k8smaster metrics]# kubectl get svc
NAME         TYPE        CLUSTER-IP   EXTERNAL-IP   PORT(S)   AGE
kubernetes   ClusterIP   10.96.0.1    <none>        443/TCP   110d
[root@k8smaster metrics]# kubectl get svc -n kube-system
NAME                   TYPE        CLUSTER-IP       EXTERNAL-IP   PORT(S)         AGE
heapster               NodePort    10.100.27.100    <none>        80:30629/TCP    20s
kube-dns               ClusterIP   10.96.0.10       <none>        53/UDP,53/TCP   110d
kubernetes-dashboard   NodePort    10.109.237.216   <none>        443:31450/TCP   19d
monitoring-influxdb    ClusterIP   10.102.40.103    <none>        8086/TCP        1d
[root@k8smaster metrics]# kubectl get pod -n kube-system|grep heap
heapster-84c9bc48c4-pfgn7              1/1       Running   0          49s
3、接下来我们部署grafana
a、对应的链接为https://raw.githubusercontent.com/kubernetes-retired/heapster/master/deploy/kube-config/influxdb/grafana.yaml下载后修改部分内容即可使用
[root@k8smaster metrics]# cat grafana.yaml
apiVersion: apps/v1
kind: Deployment
metadata:
  name: monitoring-grafana
  namespace: kube-system
spec:
  replicas: 1
  selector:
    matchLabels:
      task: monitoring
      k8s-app: grafana
  template:
    metadata:
      labels:
        task: monitoring
        k8s-app: grafana
    spec:
      containers:
      - name: grafana
        image: k8s.gcr.io/heapster-grafana-amd64:v5.0.4
        ports:
        - containerPort: 3000
          protocol: TCP
        volumeMounts:
        - mountPath: /etc/ssl/certs
          name: ca-certificates
          readOnly: true
        - mountPath: /var
          name: grafana-storage
        env:
        - name: INFLUXDB_HOST
          value: monitoring-influxdb
        - name: GF_SERVER_HTTP_PORT
          value: "3000"
          # The following env variables are required to make Grafana accessible via
          # the kubernetes api-server proxy. On production clusters, we recommend
          # removing these env variables, setup auth for grafana, and expose the grafana
          # service using a LoadBalancer or a public IP.
        - name: GF_AUTH_BASIC_ENABLED
          value: "false"
        - name: GF_AUTH_ANONYMOUS_ENABLED
          value: "true"
        - name: GF_AUTH_ANONYMOUS_ORG_ROLE
          value: Admin
        - name: GF_SERVER_ROOT_URL
          # If you're only using the API Server proxy, set this value instead:
          # value: /api/v1/namespaces/kube-system/services/monitoring-grafana/proxy
          value: /
      volumes:
      - name: ca-certificates
        hostPath:
          path: /etc/ssl/certs
      - name: grafana-storage
        emptyDir: {}
---
apiVersion: v1
kind: Service
metadata:
  labels:
    # For use as a Cluster add-on (https://github.com/kubernetes/kubernetes/tree/master/cluster/addons)
    # If you are NOT using this as an addon, you should comment out this line.
    kubernetes.io/cluster-service: 'true'
    kubernetes.io/name: monitoring-grafana
  name: monitoring-grafana
  namespace: kube-system
spec:
  # In a production setup, we recommend accessing Grafana through an external Loadbalancer
  # or through a public IP.
  # type: LoadBalancer
  # You could also use NodePort to expose the service at a randomly-generated port
  # type: NodePort
  ports:
  - port: 80
    targetPort: 3000
  selector:
    k8s-app: grafana
  type: NodePort
[root@k8smaster metrics]# kubectl apply -f grafana.yaml
deployment.apps/monitoring-grafana created
service/monitoring-grafana created
[root@k8smaster metrics]# kubectl get svc -n kube-system
NAME                   TYPE        CLUSTER-IP       EXTERNAL-IP   PORT(S)         AGE
heapster               NodePort    10.100.27.100    <none>        80:30629/TCP    12m
kube-dns               ClusterIP   10.96.0.10       <none>        53/UDP,53/TCP   110d
kubernetes-dashboard   NodePort    10.109.237.216   <none>        443:31450/TCP   19d
monitoring-grafana     NodePort    10.98.72.62      <none>        80:30070/TCP    20s
monitoring-influxdb    ClusterIP   10.102.40.103    <none>        8086/TCP        1d
[root@k8smaster metrics]# kubectl get pods -n kube-system |grep gran
[root@k8smaster metrics]# kubectl get pods -n kube-system |grep gra
monitoring-grafana-555545f477-g7hdd    1/1       Running   0          2m
b、访问192.168.10.10:30070即可
4、接下来运行我们的kubectl top命令,此时我们可以发现还是不能使用这个命令,显示获取不到各节点的10255下的容器信息
[root@k8smaster metrics]# kubectl logs heapster-84c9bc48c4-pfgn7 -n kube-system
I0827 06:11:30.880667       1 heapster.go:78] /heapster --source=kubernetes:https://kubernetes.default --sink=influxdb:http://monitoring-influxdb.kube-system.svc:8086
I0827 06:11:30.880741       1 heapster.go:79] Heapster version v1.5.4
I0827 06:11:30.881054       1 configs.go:61] Using Kubernetes client with master "https://kubernetes.default" and version v1
I0827 06:11:30.881092       1 configs.go:62] Using kubelet port 10255
I0827 06:11:31.003814       1 influxdb.go:312] created influxdb sink with options: host:monitoring-influxdb.kube-system.svc:8086 user:root db:k8s
I0827 06:11:31.003943       1 heapster.go:202] Starting with InfluxDB Sink
I0827 06:11:31.003952       1 heapster.go:202] Starting with Metric Sink
I0827 06:11:31.036488       1 heapster.go:112] Starting heapster on port 8082
E0827 06:12:05.007881       1 manager.go:101] Error in scraping containers from kubelet:192.168.10.12:10255: failed to get all container stats from Kubelet URL "http://192.168.10.12:10255/s
tats/container/": Post http://192.168.10.12:10255/stats/container/: dial tcp 192.168.10.12:10255: getsockopt: connection refusedE0827 06:12:05.011822       1 manager.go:101] Error in scraping containers from kubelet:192.168.10.11:10255: failed to get all container stats from Kubelet URL "http://192.168.10.11:10255/s
tats/container/": Post http://192.168.10.11:10255/stats/container/: dial tcp 192.168.10.11:10255: getsockopt: connection refusedE0827 06:12:05.012647       1 manager.go:101] Error in scraping containers from kubelet:192.168.10.10:10255: failed to get all container stats from Kubelet URL "http://192.168.10.10:10255/s
tats/container/": Post http://192.168.10.10:10255/stats/container/: dial tcp 192.168.10.10:10255: getsockopt: connection refused
5、kubernetes的HeapSter从1.11 版本开始就已经开始废弃了,从1.12版本就直接彻底废除了。妈的,部署半天就这样翻车了。