Introduction
Frequency-domain analysis is a tool of utmost importance in signal processing applications. Frequency-domain analysis is widely used in such areas as communications, geology, remote sensing, and image processing. While time-domain analysis shows how a signal changes over time, frequency-domain analysis shows how the signal's energy is distributed over a range of frequencies. A frequency-domain representation also includes information on the phase shift that must be applied to each frequency component in order to recover the original time signal with a combination of all the individual frequency components.
A signal can be converted between the time and frequency domains with a pair of mathematical operators called a transform. An example is the Fourier transform, which decomposes a function into the sum of a (potentially infinite) number of sine wave frequency components. The 'spectrum' of frequency components is the frequency domain representation of the signal. The inverse Fourier transform converts the frequency domain function back to a time function.
Magnitude and Phase Information of the FFT
The frequency-domain representation of a signal carries information about the signal's magnitude and phase at each frequency. This is why the output of the FFT computation is complex. A complex number,  , has a real part,
  , and an imaginary part,
  , such that
  . The magnitude of is computed as
  , and the phase of is computed as
  .
.
Example:
Use an audio example to develop some insight on what information is carried by the magnitude and the phase of a signal. To do this, load an audio file containing 15 seconds of acoustic guitar music. The sample rate of the audio signal is 44.1 kHz.
Fs = 44100;
y = audioread('guitartune.wav');
Use fft to observe the frequency content of the signal.
NFFT = length(y);
Y = fft(y,NFFT);
F = ((0:1/NFFT:1-1/NFFT)*Fs).';

The output of the FFT is a complex vector containing information about the frequency content of the signal.
The magnitude tells you the strength of the frequency components relative to other components.
The phase tells you how all the frequency components align in time.
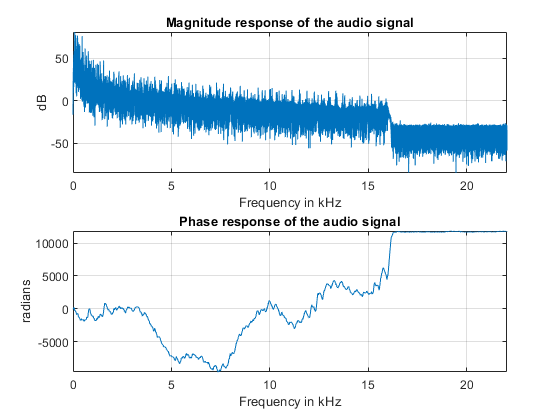
Plot the magnitude and the phase components of the frequency spectrum of the signal.
The magnitude is conveniently plotted in a logarithmic scale (dB).
The phase is unwrapped using the unwrap function so that we can see a continuous function of frequency.
magnitudeY = abs(Y);        % Magnitude of the FFT
phaseY = unwrap(angle(Y));  % Phase of the FFT

helperFrequencyAnalysisPlot1(F,magnitudeY,phaseY,NFFT)
We can apply an inverse Fourier transform to the frequency domain vector, Y, to recover the time signal.
Notice that the original time signal, y, and the recovered signal, y1, are practically the same (the norm of their difference is on the order of 1e-14).
The very small difference between the two is also due to the numerical inaccuracies.

To see the effects of changing the magnitude response of the signal,
remove frequency components above 1 kHz directly from the FFT output (by making the magnitudes equal to zero)
and listen to the effect this has on the sound of the audio file.
Removing high frequency components of a signal is referred to as lowpass filtering.

The phase of a signal has important information about when in time the notes of the song appear. To illustrate the importance of phase on the audio signal, remove the phase information completely by taking the magnitude of each frequency component. Note that by doing this you keep the magnitude response unchanged.

Get the signal back in the time domain and play the audio. You cannot recognize the original sound at all. The magnitude response is the same, no frequency components have been removed this time, but the order of the notes has disappeared completely. The signal now consists of a group of sinusoids all aligned at time equal to zero. In general, phase distortions caused by filtering can damage a signal to the point of rendering it unrecognizable.
Finding Signal Periodicities
The frequency domain representation of a signal allows you to observe several characteristics of the signal that are either not easy to see, or not visible at all when you look at the signal in the time domain. For instance, frequency-domain analysis becomes useful when you are looking for cyclic behavior of a signal.
Measuring Power
The periodogram function computes the signal's FFT and normalizes the output to obtain a power spectral density, PSD, or a power spectrum from which you can measure power. The PSD describes how the power of a time signal is distributed with frequency, it has units of watts/Hz. You compute the power spectrum by integrating each point of the PSD over the frequency interval at which that point is defined (i.e. over the resolution bandwidth of the PSD). The units of the power spectrum are watts. You can read power values directly from the power spectrum without having to integrate over an interval. Note that the PSD and power spectrum are real, so they do not contain any phase information.
Finding Spectral Components
A signal might be composed of one or more frequency components. The ability to observe all the spectral components depends on the frequency resolution of your analysis. The frequency resolution or resolution bandwidth of the power spectrum is defined as R = Fs/N, where N is the length of the signal observation. Only spectral components separated by a frequency larger than the frequency resolution will be resolved.
Reference,
1. MathWorks