在之前我们介绍过嵌入式Linux之Eclipse开发环境搭建,我们介绍了如何使用eclipse进行代码调试。这一节我们同样的我们介绍一下vs code在嵌入式linux平台下的代码调试。
我们首先回顾一下程序是如何被调试的?
如下图所示,使用GDB调试目标系统需要满足以下条件:

1.pc端得运行gdb程序
- gdb程序可以在termianl中运行,也可以在IDE中运行GDB。gdb程序运行以后,用户可以通过下gdb command去调试目标系统。更多调试命令可以参考Eclipse,OpenOCD,OpenJTAGv3.1嵌入式开发教程版本5。
2. pc端还得运行GDB Server
- GDB Server起到承上启下的作用:
1)通过TCP/IP Port与gdb程序通信,GDB Server接受来自gdb的命令;
2)GDB Server 通过USB控制Debugger,让Debugger执行gdb命令对应的动作;
3.连接Debugger
- Debugger收到gdb的命令,通过JTAG去Access CPU的Debug uint;
4.CPU的Debug uint
- CPU中的Debug uint实现各种Debug event, 例如Instruction Breakpiont, Data Breakpoint,单步执行等;
vs code下debug架构:
- vs code 对应着 IDEgdb对应着 arm-linux-gdb ;
- GDB Server 对应着 JLinkGDBServer;
- Debug Probe 对应着 JLink;
- Microcontroller 对应着 S3C2440;
arm-linux-gdb、JLinkGDBServer安装步骤参考嵌入式Linux开发环境搭建。
一、安装配置
以下步骤均是在ubuntu系统下操作。
1.1 下载
官网:https://code.visualstudio.com/,注意选择自己发行版对应的包。注意选择linux版本。

下载完后运行命令安装即可:
sudo dpkg -i code_1.63.2-1639562499_amd64.deb
成功安装后终端输入如下命令可以查看到版本号:
code -v

在终端运行code即可打开vs code界面。
1.2 插件 C/C++安装

1.3 插件C/C++ CLang command adaper安装

1.4 插件C++ intellisense安装

1.5 插件GBKtoUTF8安装

1.6 插件include Autocomplete安装

1.7 插件rainbow Brackets安装

1.8 插件Chinese安装

1.9 插件Arm Assembly安装

二、新建项目
2.1 项目新建
新建工作目录,将u-boot源码拷贝进去。
启动vs code,文件->打开文件夹:选择新建的工作目录。
2.2 配置头文件
我们使用vs code,是希望能使用“代码自动补全”这一功能。要想实现这一点,IDE自然要知道包含那些函数、变量声明的头文件所在的路径。
vs code的每一个工程都需要我们自己设置头文件的查找路径,我们也可以保存一份配置文件,新建工程时把它复制过来再改改。
vs code配置头文件查找路径以及宏定义的文件叫做c_cpp_properties.json,打开它的方法如下,ctrl + shift +P 输入:
C/C++:edit configurations(json)
选中之后回车,会打开c_cpp_propertoes.json文件。
我们需要在“includePath”中填写需要包含的头文件路径,用于让IDE知道如何补全代码。红色的是自己添加的,注意最后两条是根据你的板子决定的,我的是samsung 的sS3C2440。
{
    "configurations": [
        {
            "name": "Linux",
            "includePath": [
                "${workspaceFolder}/**",
                "${workspaceFolder}/include",
                "${workspaceFolder}/include/linux",
                "${workspaceFolder}/arch/arm/include"
            ],
            "defines": [],
            "compilerPath": "/usr/local/arm/4.3.2/bin/arm-linux-gcc",
            "cStandard": "gnu11",
            "cppStandard": "gnu++98",
            "intelliSenseMode": "linux-gcc-x64"
        }
    ],
    "version": 4
}
这里头文件添加哪些,可以参考Mini440之uboot移植之源码分析start.S(一),直接搜索include即可。
除此之外,我们还需要在 "compilerPath"中填写我们使用的交叉编译工具中的具体编译器的路径,如"compilerPath": "/usr/local/arm/4.3.2/bin/arm-linux-gcc"。
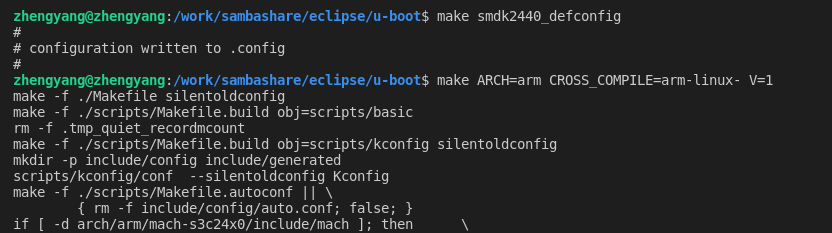
2.3 编译
make distclean
make smdk2440_config
make ARCH=arm CROSS_COMPILE=arm-linux- V=1
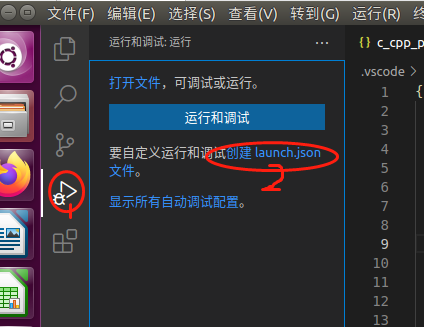
2.4 调试环境配置
我们需要创建vs code的launch.json文件并进行一些修改:
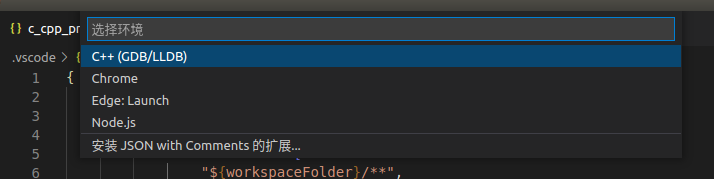
选择C++(GDB/LLDB):
修改文件为:
{
    // 使用 IntelliSense 了解相关属性。
    // 悬停以查看现有属性的描述。
    // 欲了解更多信息,请访问: https://go.microsoft.com/fwlink/?linkid=830387
    "version": "0.2.0",
    "configurations": [

        {
            "name": "(gdb) 启动",
            "type": "cppdbg",
            "request": "launch",
            "program": "${workspaceRoot}/u-boot",
            "args": [],
            "stopAtEntry": false,
            "cwd": "${fileDirname}",
            "miDebuggerPath":"/usr/local/gdb/bin/arm-linux-gdb",
            "targetArchitecture": "arm",
            "environment": [],
            "externalConsole": false,
            "MIMode": "gdb",
            "setupCommands": [
                {
                    "text": "file ${workspaceRoot}/u-boot"
                },
                {
                    "text": "source ${workspaceRoot}/u-boot.gdbinit",
                }
            ]
        }
    ]
}
配置如下:
- "miDebuggerPath": 表示的是arm格式gdb的路径,这里我设置为"/usr/local/gdb/bin/arm-linux-gdb;
-
"miDebuggerServerAddress":表示的是我们server端的地址,如:192.168.3.12为开发板的ip,9001为端口号,可自行设置,其范围为:0~65536,0~1023 的端口一般由系统分配给特定的服务程序。这里我们不设置该参数。
- "program": 表示的是编译生成的elf文件,这里我们设置为"${workspaceRoot}/u-boot";
- "setupCommands":初始化执行的arm-linux-gdb命令,第一个元素设置为"text": "file ${workspaceRoot}/u-boot",第二个元素配置未gdb命令脚本,用来连接J-Link gdb server、初始化CPU、加载程序;
u-boot.gdbinit文件:
# connect to the J-Link gdb server
target remote localhost:2331
# Set JTAG speed to 30 kHz
monitor endian little
monitor speed 30
# Reset the target
monitor reset
monitor sleep 10
#
# CPU core initialization (to be done by user)
#
# Set the processor mode
monitor reg cpsr = 0xd3
#config MMU 配置MMU
#flush v3/v4 cache
monitor cp15 7, 7, 0, 0 = 0x0
#/* flush v4 TLB  协处理器*/
monitor cp15 8, 7, 0, 0 = 0x0
#disable MMU stuff and caches
monitor cp15 1, 0, 0, 0 =0x1002
#Peri port setup
monitor cp15 15, 2, 0, 4 = 0x70000013
#disable watchdog kangear 关闭看门狗
monitor MemU32 0x53000000  =  0x00000000
monitor sleep 10
#disable interrupt kangear 关闭中断
monitor MemU32 0x4A000008  =  0xffffffff
monitor MemU32 0x4A00001C  =  0x7fff

#set clock

#initialize system clocks --- locktime register
monitor MemU32 0x4C000000 = 0xFF000000

#initialize system clocks --- clock-divn register
monitor MemU32 0x4C000014 = 0x5            #CLKDVIN_400_148

#initialize system clocks --- mpll register
monitor MemU32 0x4C000004 = 0x7f021    #default clock


#config sdram
monitor MemU32 0x53000000 0x00000000
monitor MemU32 0x4A000008 0xFFFFFFFF
monitor MemU32 0x4A00001C 0x000007FF
monitor MemU32 0x53000000 0x00000000
monitor MemU32 0x56000050 0x000055AA
monitor MemU32 0x4C000014 0x00000007
monitor MemU32 0x4C000000 0x00FFFFFF
monitor MemU32 0x4C000004 0x00061012
monitor MemU32 0x4C000008 0x00040042
monitor MemU32 0x48000000 0x22111120
monitor MemU32 0x48000004 0x00002F50
monitor MemU32 0x48000008 0x00000700
monitor MemU32 0x4800000C 0x00000700
monitor MemU32 0x48000010 0x00000700
monitor MemU32 0x48000014 0x00000700
monitor MemU32 0x48000018 0x0007FFFC
monitor MemU32 0x4800001C 0x00018005
monitor MemU32 0x48000020 0x00018005
monitor MemU32 0x48000024 0x008E0459
monitor MemU32 0x48000028 0x00000032
monitor MemU32 0x4800002C 0x00000030
monitor MemU32 0x48000030 0x00000030

# Setup GDB for faster downloads
#set remote memory-write-packet-size 1024
monitor speed auto
#break _start
load
2.4 开始调试
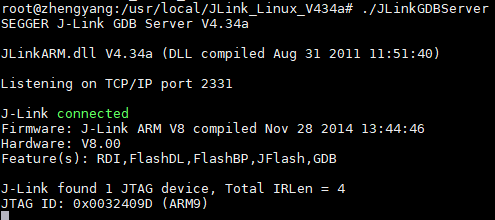
在终端启动JLinkGDBServer:
cd /usr/local# cd JLink_Linux_V434a/
./JLinkGDBServer:
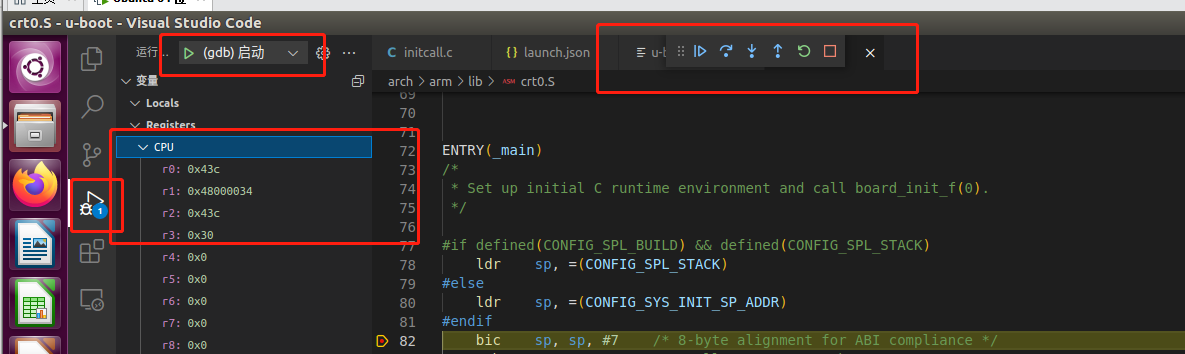
vs code在arch/arm/lib/crt0.s开始设下断点,并运行程序:
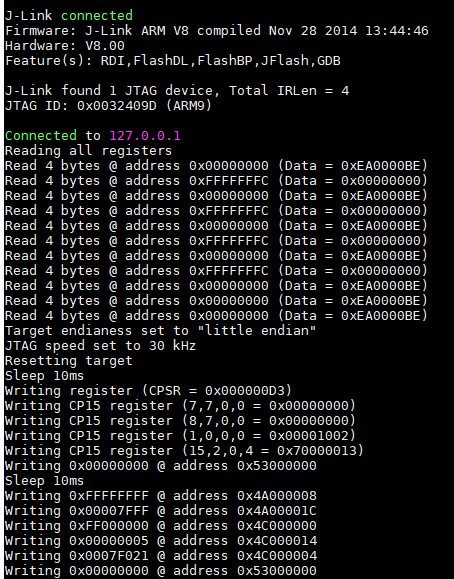
终端输出gdb命令执行结果:
参考文章
[1]Linux下使用VSCode和CMake搭载C/C++开发环境
[2]使用IDE(vs code)进行嵌入式linux驱动开发