LiveCharts是一款非常好用的WPF图表绘制类库,相比其他同类类库,LiveCharts的UI风格样式更加多样更加美观。
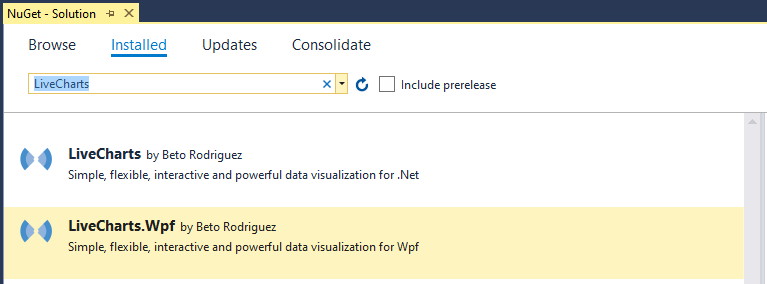
准备工作:安装以下两个类库:
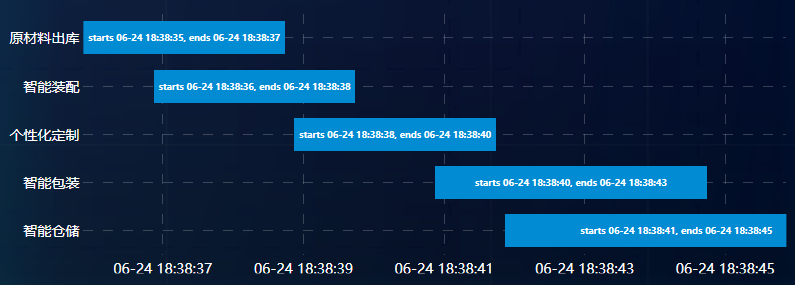
1、甘特图
前台View代码


 1 <lvc:CartesianChart Grid.Row="2" Zoom="None" Margin="0,40">
 2     <lvc:CartesianChart.AxisX>
 3         <!--LabelFormatter-轴坐标标签样式;MinValue-轴坐标起点;MaxValue-轴坐标终点-->
 4         <lvc:Axis Style="{StaticResource FontChartAxis}"
 5                   LabelFormatter="{Binding Path=Formatter}"
 6                   MinValue="{Binding Path=From, Mode=TwoWay}"
 7                   MaxValue="{Binding Path=To, Mode=TwoWay}">
 8             <!--Separator-坐标平面分割线 StrokeDashArray-分割线虚线间隔-->
 9             <lvc:Axis.Separator>
10                 <lvc:Separator Stroke="#33ffffff" StrokeDashArray="10"/>
11             </lvc:Axis.Separator>
12         </lvc:Axis>
13     </lvc:CartesianChart.AxisX>
14     <lvc:CartesianChart.AxisY>
15         <!--Labels-轴坐标标签列表-->
16         <lvc:Axis Style="{StaticResource FontChartAxis}"
17                   Labels="{Binding Path=Labels}">
18             <lvc:Axis.Separator>
19                 <lvc:Separator Stroke="#33ffffff" StrokeDashArray="10"/>
20             </lvc:Axis.Separator>
21         </lvc:Axis>
22     </lvc:CartesianChart.AxisY>
23     <!--Series-数据序列-->
24     <lvc:CartesianChart.Series>
25         <!--RowSeries-数据序列按行显示 LabelPosition-数据标签位置 DataLabels-是否显示数据标签 Values-数据序列值-->
26         <lvc:RowSeries Style="{StaticResource FontRowSeries}"
27                        Fill="#008bd3" LabelsPosition="Parallel" DataLabels="True" Values="{Binding Path=Values}"/>
28     </lvc:CartesianChart.Series>
29 </lvc:CartesianChart>
后台ViewModel代码
 1 private double _from;
 2 private double _to;
 3 private Func<double, string> _formatter;
 4 private string[] _labels;
 5 private ChartValues<GanttPoint> _values;
 6 public double From { get { return _from; } set { _from = value; NotifyOfPropertyChange(() => From); } }
 7 public double To { get { return _to; } set { _to = value; NotifyOfPropertyChange(() => To); } }
 8 public Func<double, string> Formatter { get { return _formatter; } set { _formatter = value; NotifyOfPropertyChange(() => Formatter); } }
 9 public string[] Labels { get { return _labels; } set { _labels = value; NotifyOfPropertyChange(() => Labels); } }
10 public ChartValues<GanttPoint> Values { get { return _values; } set { _values = value; NotifyOfPropertyChange(() => Values); } }
11
12 public void ShowGanttChart()
13 {
14     var now = DateTime.Now;
15
16     Values = new ChartValues<GanttPoint>
17     {
18         new GanttPoint(now.Ticks, now.AddSeconds(2).Ticks),
19         new GanttPoint(now.AddSeconds(1).Ticks, now.AddSeconds(3).Ticks),
20         new GanttPoint(now.AddSeconds(3).Ticks, now.AddSeconds(5).Ticks),
21         new GanttPoint(now.AddSeconds(5).Ticks, now.AddSeconds(8).Ticks),
22         new GanttPoint(now.AddSeconds(6).Ticks, now.AddSeconds(10).Ticks)
23     };
24
25     Formatter = value => new DateTime((long)value).ToString("MM-dd HH:mm:ss");
26
27     Labels = new[]
28     {
29         "原材料出库", "智能装配","个性化定制", "智能包装", "智能仓储"
30     };
31     From = _values.First().StartPoint;
32     To = _values.Last().EndPoint;
33 }
效果图
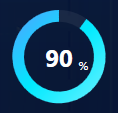
2、进度环
前台View代码
 1 <!--Gauge进度环 GaugeBackground背景环颜色 HighFontSize环内数字字号 Uses360Mode半圆还是整圆 InnerRadius内圆半径 Value环内数字值-->
 2 <lvc:Gauge Grid.Row="0" GaugeBackground="#11ffffff" HighFontSize="24"
 3            Uses360Mode="False" From="0" To="100" InnerRadius="35" Value="{Binding OrderProgress}" >
 4     <!--该设置:起点零点 方向逆时针-->
 5     <lvc:Gauge.GaugeRenderTransform>
 6         <TransformGroup>
 7             <RotateTransform Angle="90"></RotateTransform>
 8             <ScaleTransform ScaleX="-1"></ScaleTransform>
 9         </TransformGroup>
10     </lvc:Gauge.GaugeRenderTransform>
11     <!--设置圆环的颜色渐变-->
12     <lvc:Gauge.GaugeActiveFill>
13         <LinearGradientBrush>
14             <GradientStop Color="#539fff" Offset="0.0" />
15             <GradientStop Color="#00eaff" Offset="0.5" />
16             <GradientStop Color="#6af0ff" Offset="1.0" />
17         </LinearGradientBrush>
18     </lvc:Gauge.GaugeActiveFill>
19 </lvc:Gauge>
后台ViewModel代码
1 private double _orderProgress;
2 public double OrderProgress { get { return _orderProgress; } set { _orderProgress = value; NotifyOfPropertyChange(() => OrderProgress); } }
3
4 private void ShowGauge()
5 {
6     OrderProgress = 90;
7 }
效果图
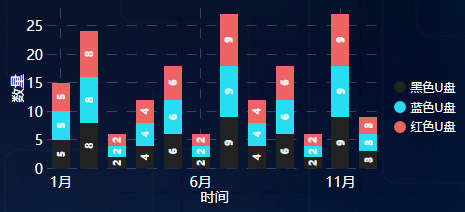
3、柱状堆积图
前台View代码
 1 <!--柱状堆积图-->
 2 <!--LegendLocation图例位置-->
 3 <lvc:CartesianChart Grid.Column="1" LegendLocation="Right" Margin="20,0">
 4     <lvc:CartesianChart.AxisX>
 5         <lvc:Axis Style="{StaticResource FontChartAxis}" Labels="{Binding Labels}" Title="时间">
 6             <lvc:Axis.Separator>
 7                 <!--Step柱间隔-->
 8                 <lvc:Separator Step="5" Stroke="#33ffffff" StrokeDashArray="10"/>
 9             </lvc:Axis.Separator>
10         </lvc:Axis>
11     </lvc:CartesianChart.AxisX>
12     <lvc:CartesianChart.AxisY>
13         <lvc:Axis Style="{StaticResource FontChartAxis}" Title="数量">
14             <lvc:Axis.Separator>
15                 <lvc:Separator Stroke="#33ffffff" StrokeDashArray="10"/>
16             </lvc:Axis.Separator>
17         </lvc:Axis>
18     </lvc:CartesianChart.AxisY>
19     <lvc:CartesianChart.Series>
20         <!--StackedColumnSeries要比较的其中一类 MaxColumnWidth柱状图宽度 DataLabels是否显示柱状图数值 Title图例中名称-->
21         <lvc:StackedColumnSeries Style="{StaticResource FontStackedColumnSeries}"
22                                  Fill="#222222" LabelsPosition="Merged" MaxColumnWidth="20" DataLabels="True"
23                                  Values="{Binding V1}" Title="黑色U盘">
24         </lvc:StackedColumnSeries>
25         <lvc:StackedColumnSeries Style="{StaticResource FontStackedColumnSeries}"
26                                  Fill="#26def2" LabelsPosition="Merged" MaxColumnWidth="20" DataLabels="True"
27                                  Values="{Binding V2}" Title="蓝色U盘">
28         </lvc:StackedColumnSeries>
29         <lvc:StackedColumnSeries Style="{StaticResource FontStackedColumnSeries}"
30                                  Fill="#ee6363" LabelsPosition="Merged" MaxColumnWidth="20" DataLabels="True"
31                                  Values="{Binding V3}" Title="红色U盘">
32         </lvc:StackedColumnSeries>
33     </lvc:CartesianChart.Series>
34     <lvc:CartesianChart.ChartLegend>
35         <!--BulletSize图例中圆点尺寸-->
36         <lvc:DefaultLegend BulletSize="12" Style="{StaticResource FontChartLegend}"/>
37     </lvc:CartesianChart.ChartLegend>
38 </lvc:CartesianChart>
后台ViewModel代码
 1 private string[] _labels;
 2 private IChartValues _v1;
 3 private IChartValues _v2;
 4 private IChartValues _v3;
 5 public IChartValues V1 { get { return _v1; } set { _v1 = value; NotifyOfPropertyChange(() => V1); } }
 6 public IChartValues V2 { get { return _v2; } set { _v2 = value; NotifyOfPropertyChange(() => V2); } }
 7 public IChartValues V3 { get { return _v3; } set { _v3 = value; NotifyOfPropertyChange(() => V3); } }
 8 public string[] Labels { get { return _labels; } set { _labels = value; NotifyOfPropertyChange(() => Labels); } }
 9 private void ShowStackedColumn()
10 {
11     V1 = new ChartValues<ObservableValue>
12             {
13                 new ObservableValue(5),
14                 new ObservableValue(8),
15                 new ObservableValue(2),
16                 new ObservableValue(4),
17                 new ObservableValue(6),
18                 new ObservableValue(2),
19                 new ObservableValue(9),
20                 new ObservableValue(4),
21                 new ObservableValue(6),
22                 new ObservableValue(2),
23                 new ObservableValue(9),
24                 new ObservableValue(3)
25             };
26     V2 = new ChartValues<ObservableValue>
27             {
28                 new ObservableValue(5),
29                 new ObservableValue(8),
30                 new ObservableValue(2),
31                 new ObservableValue(4),
32                 new ObservableValue(6),
33                 new ObservableValue(2),
34                 new ObservableValue(9),
35                 new ObservableValue(4),
36                 new ObservableValue(6),
37                 new ObservableValue(2),
38                 new ObservableValue(9),
39                 new ObservableValue(3)
40             };
41     V3 = new ChartValues<ObservableValue>
42             {
43                 new ObservableValue(5),
44                 new ObservableValue(8),
45                 new ObservableValue(2),
46                 new ObservableValue(4),
47                 new ObservableValue(6),
48                 new ObservableValue(2),
49                 new ObservableValue(9),
50                 new ObservableValue(4),
51                 new ObservableValue(6),
52                 new ObservableValue(2),
53                 new ObservableValue(9),
54                 new ObservableValue(3)
55             };
56
57     Labels = new[]
58     {
59         "1月", "2月","3月", "4月", "5月", "6月", "7月", "8月", "9月", "10月", "11月", "12月"
60     };
61 }
效果图
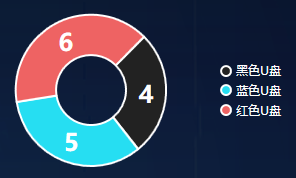
4、饼状图
前台代码
 1 <!--环形饼状图-->
 2 <!--InnerRadius内圆半径-->
 3 <lvc:PieChart Grid.Column="0"  Margin="80,25" LegendLocation="Right" InnerRadius="35">
 4     <lvc:PieChart.Series>
 5         <!--PieSeries要比较的其中一类 -->
 6         <lvc:PieSeries Style="{StaticResource FontPieSeries}" Fill="#222222" DataLabels="True" Values="4" Title="黑色U盘"/>
 7         <lvc:PieSeries Style="{StaticResource FontPieSeries}" Fill="#26def2" DataLabels="True" Values="5" Title="蓝色U盘"/>
 8         <lvc:PieSeries Style="{StaticResource FontPieSeries}" Fill="#ee6363" DataLabels="True" Values="6" Title="红色U盘"/>
 9     </lvc:PieChart.Series>
10     <lvc:PieChart.ChartLegend>
11         <lvc:DefaultLegend BulletSize="12" Style="{StaticResource FontChartLegend}"/>
12     </lvc:PieChart.ChartLegend>
13 </lvc:PieChart>
效果图
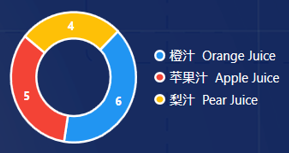
或者:
前台代码
1 <lvc:PieChart Name="Chart" Grid.Row="1" Grid.Column="3" Grid.ColumnSpan="4"
2                               Series="{Binding OrderCountSeries}" Margin="0,0,35,0" LegendLocation="Right" InnerRadius="25">
3                     <lvc:PieChart.ChartLegend>
4                         <lvc:DefaultLegend BulletSize="18" Style="{StaticResource FontDefaultStyle}"></lvc:DefaultLegend>
5                     </lvc:PieChart.ChartLegend>
6                 </lvc:PieChart>
后台代码
 1 private SeriesCollection _orderCountSeries;
 2 public SeriesCollection OrderCountSeries { get { return _orderCountSeries; } set { _orderCountSeries = value; NotifyOfPropertyChange(() => OrderCountSeries); } }
 3 public ObservableValue OrangeOrderCount { get; set; } = new ObservableValue();
 4 public ObservableValue AppleOrderCount { get; set; } = new ObservableValue();
 5 public ObservableValue PearOrderCount { get; set; } = new ObservableValue();
 6
 7 private void InitializeChartSeries()
 8 {
 9     OrderCountSeries = new SeriesCollection
10     {
11         new PieSeries
12         {
13             Title = "橙    汁    Orange",
14             Values = new ChartValues<ObservableValue> { new ObservableValue() },
15             DataLabels = true,
16             FontSize = 28
17         },
18         new PieSeries
19         {
20             Title = "苹果汁    Apple",
21             Values = new ChartValues<ObservableValue> { new ObservableValue() },
22             DataLabels = true,
23             FontSize = 28
24         },
25         new PieSeries
26         {
27             Title = "梨    汁    Pear",
28             Values = new ChartValues<ObservableValue> { new ObservableValue() },
29             DataLabels = true,
30             FontSize = 28
31         }
32     };
33 }
34
35 private void UpdateChartSeries()
36 {
37     OrangeOrderCount.Value = TodaysFinishedOrderList != null ? TodaysFinishedOrderList.FindAll(o => o.PRODUCT_CODE == (int)ItemType.Orange).Count : 0;
38     AppleOrderCount.Value = TodaysFinishedOrderList != null ? TodaysFinishedOrderList.FindAll(o => o.PRODUCT_CODE == (int)ItemType.Apple).Count : 0;
39     PearOrderCount.Value = TodaysFinishedOrderList != null ? TodaysFinishedOrderList.FindAll(o => o.PRODUCT_CODE == (int)ItemType.Pear).Count : 0;
40
41     OrderCountSeries[0].Values[0] = OrangeOrderCount;
42     OrderCountSeries[1].Values[0] = AppleOrderCount;
43     OrderCountSeries[2].Values[0] = PearOrderCount;
44 }
效果图
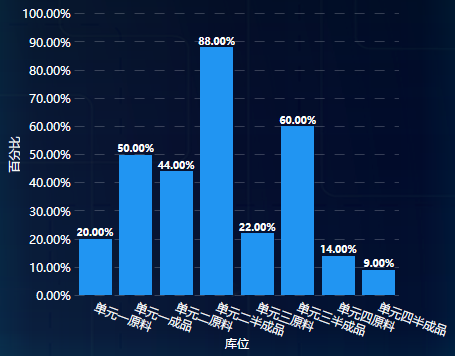
5、柱状图
前台代码
 1 <!--LegendLocation图例位置-->
 2 <lvc:CartesianChart Margin="20,75,20,15">
 3     <lvc:CartesianChart.AxisX>
 4         <lvc:Axis Style="{StaticResource FontChartAxis}" FontSize="12" Labels="{Binding Path=StorageLabels}" Title="库位" LabelsRotation="20">
 5             <lvc:Axis.Separator>
 6                 <!--Step柱间隔-->
 7                 <lvc:Separator Step="1" IsEnabled="False"/>
 8             </lvc:Axis.Separator>
 9         </lvc:Axis>
10     </lvc:CartesianChart.AxisX>
11     <lvc:CartesianChart.AxisY>
12         <lvc:Axis Style="{StaticResource FontChartAxis}" FontSize="12" Title="百分比" LabelFormatter="{Binding Path=AxisPercentage}">
13             <lvc:Axis.Separator>
14                 <lvc:Separator Stroke="#33ffffff" StrokeDashArray="10"/>
15             </lvc:Axis.Separator>
16         </lvc:Axis>
17     </lvc:CartesianChart.AxisY>
18     <lvc:CartesianChart.Series>
19         <lvc:ColumnSeries Style="{StaticResource FontColumnSeries}" Values="{Binding Path=StoragePercentages}"
20                           DataLabels="True" LabelsPosition="Top"/>
21     </lvc:CartesianChart.Series>
22     <lvc:CartesianChart.ChartLegend>
23         <!--BulletSize图例中圆点尺寸-->
24         <lvc:DefaultLegend BulletSize="12" Style="{StaticResource FontChartLegend}"/>
25     </lvc:CartesianChart.ChartLegend>
26 </lvc:CartesianChart>
后台代码
 1 private Func<double, string> _axisPercentage;
 2 private string[] _storageLabels;
 3 private IChartValues _storagePercentages;
 4 public Func<double, string> AxisPercentage { get { return _axisPercentage; } set { _axisPercentage = value; NotifyOfPropertyChange(() => AxisPercentage); } }
 5 public string[] StorageLabels { get { return _storageLabels; } set { _storageLabels = value; NotifyOfPropertyChange(() => StorageLabels); } }
 6 public IChartValues StoragePercentages { get { return _storagePercentages; } set { _storagePercentages = value; NotifyOfPropertyChange(() => StoragePercentages); } }
 7 private void ShowStoragePercentageColumnChart()
 8 {
 9     StorageLabels = new[]
10     {
11         "单元一原料","单元一成品","单元二原料","单元二半成品","单元三原料","单元三半成品","单元四原料","单元四半成品"
12     };
13     AxisPercentage = val => val.ToString("P");
14     StoragePercentages = new ChartValues<double> { 0.2, 0.5, 0.44, 0.88, 0.22, 0.6, 0.14, 0.09 };
15 }
效果图
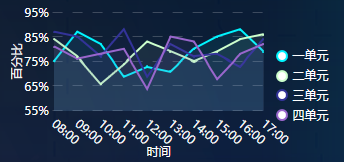
6、折线图
前台代码
 1 <lvc:CartesianChart Grid.Column="2" LegendLocation="Right" Margin="15,0">
 2     <lvc:CartesianChart.AxisX>
 3         <lvc:Axis Style="{StaticResource FontChartAxis}" FontSize="12" Labels="{Binding Path=XTimeLabels}" Title="时间" LabelsRotation="40">
 4             <lvc:Axis.Separator>
 5                 <!--Step柱间隔-->
 6                 <lvc:Separator Step="1" IsEnabled="False"/>
 7             </lvc:Axis.Separator>
 8         </lvc:Axis>
 9     </lvc:CartesianChart.AxisX>
10     <lvc:CartesianChart.AxisY>
11         <lvc:Axis Style="{StaticResource FontChartAxis}" FontSize="12" Title="百分比" LabelFormatter="{Binding Path=YPercentageFormat}">
12             <lvc:Axis.Separator>
13                 <lvc:Separator Stroke="#33ffffff" StrokeDashArray="10"/>
14             </lvc:Axis.Separator>
15         </lvc:Axis>
16     </lvc:CartesianChart.AxisY>
17     <lvc:CartesianChart.Series>
18         <lvc:LineSeries Values="{Binding OccupancyRatesCell1}" PointGeometrySize="2" Stroke="#00f5ff" Fill="#1100f5ff" LineSmoothness="0" Title="一单元"/>
19         <lvc:LineSeries Values="{Binding OccupancyRatesCell2}" PointGeometrySize="2" Stroke="#ccffcc" Fill="#11ccffcc" LineSmoothness="0" Title="二单元"/>
20         <lvc:LineSeries Values="{Binding OccupancyRatesCell3}" PointGeometrySize="2" Stroke="#333399" Fill="#11333399" LineSmoothness="0" Title="三单元"/>
21         <lvc:LineSeries Values="{Binding OccupancyRatesCell4}" PointGeometrySize="2" Stroke="#9966cc" Fill="#119966cc" LineSmoothness="0" Title="四单元"/>
22     </lvc:CartesianChart.Series>
23     <lvc:CartesianChart.ChartLegend>
24         <!--BulletSize图例中圆点尺寸-->
25         <lvc:DefaultLegend BulletSize="12" Style="{StaticResource FontChartLegend}"/>
26     </lvc:CartesianChart.ChartLegend>
27 </lvc:CartesianChart>
后台代码
 1 private string[] _xTimeLabels;
 2 private Func<double, string> _yPercentageFormat;
 3 private ChartValues<double> _occupancyRatesCell1;
 4 private ChartValues<double> _occupancyRatesCell2;
 5 private ChartValues<double> _occupancyRatesCell3;
 6 private ChartValues<double> _occupancyRatesCell4;
 7 public string[] XTimeLabels { get { return _xTimeLabels; } set { _xTimeLabels = value; NotifyOfPropertyChange(() => XTimeLabels); } }
 8 public Func<double, string> YPercentageFormat { get { return _yPercentageFormat; } set { _yPercentageFormat = value; NotifyOfPropertyChange(() => YPercentageFormat); } }
 9 public ChartValues<double> OccupancyRatesCell1 { get { return _occupancyRatesCell1; } set { _occupancyRatesCell1 = value; NotifyOfPropertyChange(() => OccupancyRatesCell1); } }
10 public ChartValues<double> OccupancyRatesCell2 { get { return _occupancyRatesCell2; } set { _occupancyRatesCell2 = value; NotifyOfPropertyChange(() => OccupancyRatesCell2); } }
11 public ChartValues<double> OccupancyRatesCell3 { get { return _occupancyRatesCell3; } set { _occupancyRatesCell3 = value; NotifyOfPropertyChange(() => OccupancyRatesCell3); } }
12 public ChartValues<double> OccupancyRatesCell4 { get { return _occupancyRatesCell4; } set { _occupancyRatesCell4 = value; NotifyOfPropertyChange(() => OccupancyRatesCell4); } }
13 private void InitOccupancyRate()
14 {
15     YPercentageFormat = value => value.ToString("P0"); //P0表示只保留整数,P表示保留小数点后两位
16     XTimeLabels = new[] { "08:00", "09:00", "10:00", "11:00", "12:00", "13:00", "14:00", "15:00", "16:00", "17:00" }; ;
17     OccupancyRatesCell1 = new ChartValues<double> { 0.75, 0.87, 0.82, 0.69, 0.73, 0.71, 0.80, 0.85, 0.88, 0.79 };
18     OccupancyRatesCell2 = new ChartValues<double> { 0.84, 0.77, 0.66, 0.74, 0.83, 0.79, 0.75, 0.79, 0.84, 0.86 };
19     OccupancyRatesCell3 = new ChartValues<double> { 0.87, 0.85, 0.77, 0.88, 0.69, 0.82, 0.77, 0.78, 0.73, 0.84 };
20     OccupancyRatesCell4 = new ChartValues<double> { 0.81, 0.76, 0.78, 0.80, 0.64, 0.85, 0.83, 0.68, 0.78, 0.82 };
21 }
效果图
7、LiveCharts所用到的样式Style.xaml
 1 <!--LiveCharts文字样式-->
 2 <!--图表坐标轴文字-->
 3 <Style x:Key="FontChartAxis" TargetType="{x:Type lvc:Axis}">
 4     <Setter Property="HorizontalAlignment" Value="Center"/>
 5     <Setter Property="VerticalAlignment" Value="Center"/>
 6     <Setter Property="FontFamily" Value="Microsoft Yahei"/>
 7     <Setter Property="FontSize" Value="14"/>
 8     <Setter Property="Foreground" Value="White"/>
 9 </Style>
10 <!--柱状堆积图文字-->
11 <Style x:Key="FontStackedColumnSeries" TargetType="{x:Type lvc:StackedColumnSeries}">
12     <Setter Property="HorizontalAlignment" Value="Center"/>
13     <Setter Property="VerticalAlignment" Value="Center"/>
14     <Setter Property="FontFamily" Value="Microsoft Yahei"/>
15     <Setter Property="FontSize" Value="10"/>
16     <Setter Property="Foreground" Value="White"/>
17 </Style>
18 <!--柱状图文字-->
19 <Style x:Key="FontColumnSeries" TargetType="{x:Type lvc:ColumnSeries}">
20     <Setter Property="HorizontalAlignment" Value="Center"/>
21     <Setter Property="VerticalAlignment" Value="Center"/>
22     <Setter Property="FontFamily" Value="Microsoft Yahei"/>
23     <Setter Property="FontSize" Value="10"/>
24     <Setter Property="Foreground" Value="White"/>
25 </Style>
26 <!--图例文字-->
27 <Style x:Key="FontChartLegend" TargetType="{x:Type lvc:DefaultLegend}">
28     <Setter Property="HorizontalAlignment" Value="Center"/>
29     <Setter Property="VerticalAlignment" Value="Center"/>
30     <Setter Property="FontFamily" Value="Microsoft Yahei"/>
31     <Setter Property="FontSize" Value="12"/>
32     <Setter Property="Foreground" Value="White"/>
33 </Style>
34 <!--图表行文字-->
35 <Style x:Key="FontRowSeries" TargetType="{x:Type lvc:RowSeries}">
36     <Setter Property="HorizontalAlignment" Value="Center"/>
37     <Setter Property="VerticalAlignment" Value="Center"/>
38     <Setter Property="FontFamily" Value="Microsoft Yahei"/>
39     <Setter Property="FontSize" Value="9"/>
40     <Setter Property="Foreground" Value="White"/>
41 </Style>
42 <!--饼状图文字-->
43 <Style x:Key="FontPieSeries" TargetType="{x:Type lvc:PieSeries}">
44     <Setter Property="HorizontalAlignment" Value="Center"/>
45     <Setter Property="VerticalAlignment" Value="Center"/>
46     <Setter Property="FontFamily" Value="Microsoft Yahei"/>
47     <Setter Property="FontSize" Value="24"/>
48     <Setter Property="Foreground" Value="White"/>
49 </Style>