Preface :
I made some time to write the article today, I'm so busy lately, but learning must hold on and never stop.
Of cause, I also refered to other articles, here is link , I added some ideas of my own.
In our work, we will meet the following situations: some database object are deleted or altered or droped or created, they can have big impact for your DB, you need to find the root cause: who do? why do?
of cause, you can use DDL trigger to catch these events, there's nothing you can do if you have no related triggers, at this time, "SQL SERVER TRACE" would be a good choice for you.
Rudimentary Knowledge:
"Default Trace" will auto run by default and it's lightweight, so no heavy burden on the system, it can't instead of DDL trigger, it like a monitor for SQL SERVER instances.
"default trace" can't trace all events, it catch some key messages only, it include: auditing events,database events,error events,full text events,object creation,object deletion,object alteration. we will discuss the event of object level.
Some demo:
you can verify "default trace" is turned on by following statements:
select * from sys.configurations where configuration_id = 1568
trace default path:
select * from ::fn_trace_getinfo(0)

you can use following statements to turn "trace"
sp_configure 'show advanced options', 1;
 go
 reconfigure;
 go
sp_configure 'default trace enabled', 1;
 go
 reconfigure;
 go
let's create a new DB
use master
go
create database TraceDB
using this statement to open trace files
select
  loginname 'loginname(执行该操作的操作人的登陆账号)',
  hostname 'hostname(执行该操作的时候使用的计算机名)',
  applicationname 'applicationname(执行该操作使用的APP的名称)',
  servername 'servername(操作的服务器名称)',
  databasename 'databasename(操作的数据库名称)',
  objectname 'objectname(操作的对象)',
  starttime 'starttime(操作的时间)',
  e.name as 'EventName(操作的事件类型)',
  loginsid ,
  spid,
  e.category_id,
  cat.name as [CategoryName],
  textdata,
  eventclass,
  eventsubclass --0表示begin,1表示commit,大多数操作都有2条
from ::fn_trace_gettable(( select CAST(value AS VARCHAR(100)) from ::fn_trace_getinfo(0) where property =2),0)
  inner join sys.trace_events e
          on eventclass = trace_event_id
  inner join sys.trace_categories as cat
          on e.category_id = cat.category_id
where 1=1
      AND StartTime>'2019-05-16'
      and databasename = 'TraceDB'
      --and objectname is null  --根据objectname来过滤
      --and e.category_id = 5  --category 5表示对象
      and e.trace_event_id = 123 --trace_event_id: 46表示Create对象,47表示Drop对象,164表示修改对象
      order by starttime desc
you can see 2 records, they are these events of begin and commit
we create a table:
use TraceDB
go
create table dbo.MyTable(
  id int identity(1,1) not null,
  sometext char(3) null
) on primary
of cause, "default trace" also can catch these evens: "drop","alter"
here is catch log auto growth event:
代码

select
  loginname,
  loginsid,
  spid,
  hostname,
  applicationname,
  servername,
  databasename,
  objectname,
  e.category_id,
  cat.name,
  textdata,
  starttime,
  endtime,
  duration,
  eventclass,
  eventsubclass,
  e.name as EventName
from ::fn_trace_gettable('C:Program FilesMicrosoft SQL ServerMSSQL.1MSSQLLOGlog.trc',0)
  inner join sys.trace_events e
          on eventclass = trace_event_id
  inner join sys.trace_categories as cat
          on e.category_id = cat.category_id
where databasename = 'TraceDB' and
      e.category_id = 2 and --categroy 2表示database
      e.trace_event_id = 93 --93表示日志文件自动增长事件
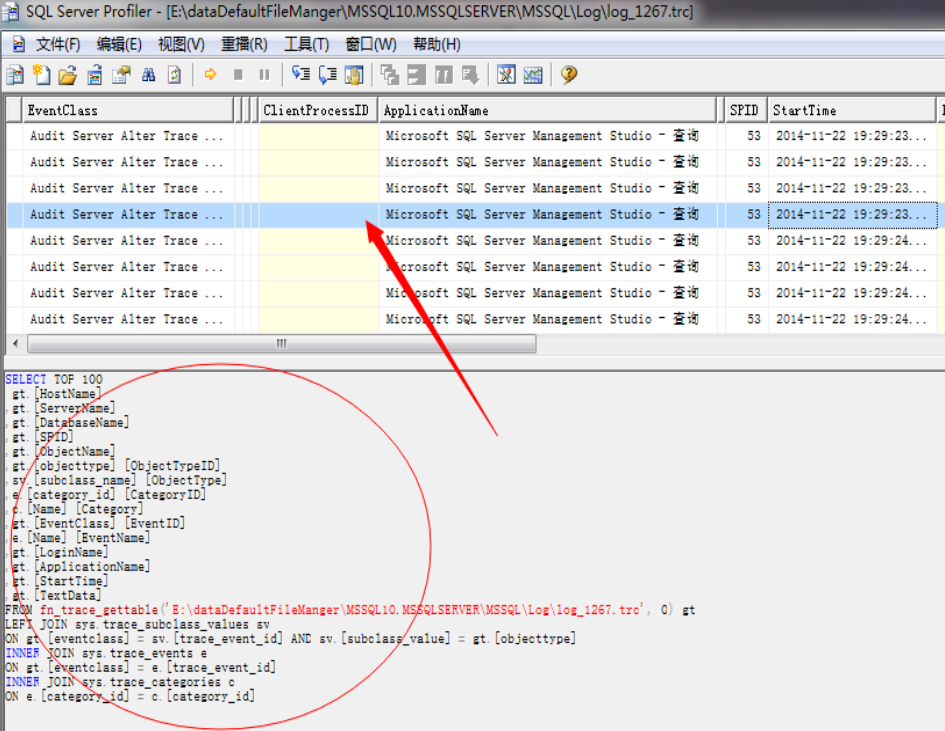
you also can use SQLSERVER profiler open the trace files and you can filter some event and event columns.