最近项目中需要用到地图监控,需求:
1.CAD文件直接解析,web显示
2.可以放大缩小、平移
3.可以显示小车运动位置及轨迹
4.点击小车可以显示相关信息
完整代码下载地址:https://gitee.com/zhuyapeng/cad_file_web_display
如果觉得对你有帮助,帮忙给个星。
这里只加入地图导入、放大、缩小、平移功能。
网上查看了些质料,没用可供修改的。有个Thres.js框架做的解析,感觉太庞大。后来就自己写。
整体流程:
1.CAD文件另存为dxf文件。
2.c#后台读取dxf文件,用第三方框架netDxf解析。这次只解析了部分元素,后续继续完善
3.前端拿到数据,通过画布画出。
直接上个结果图:
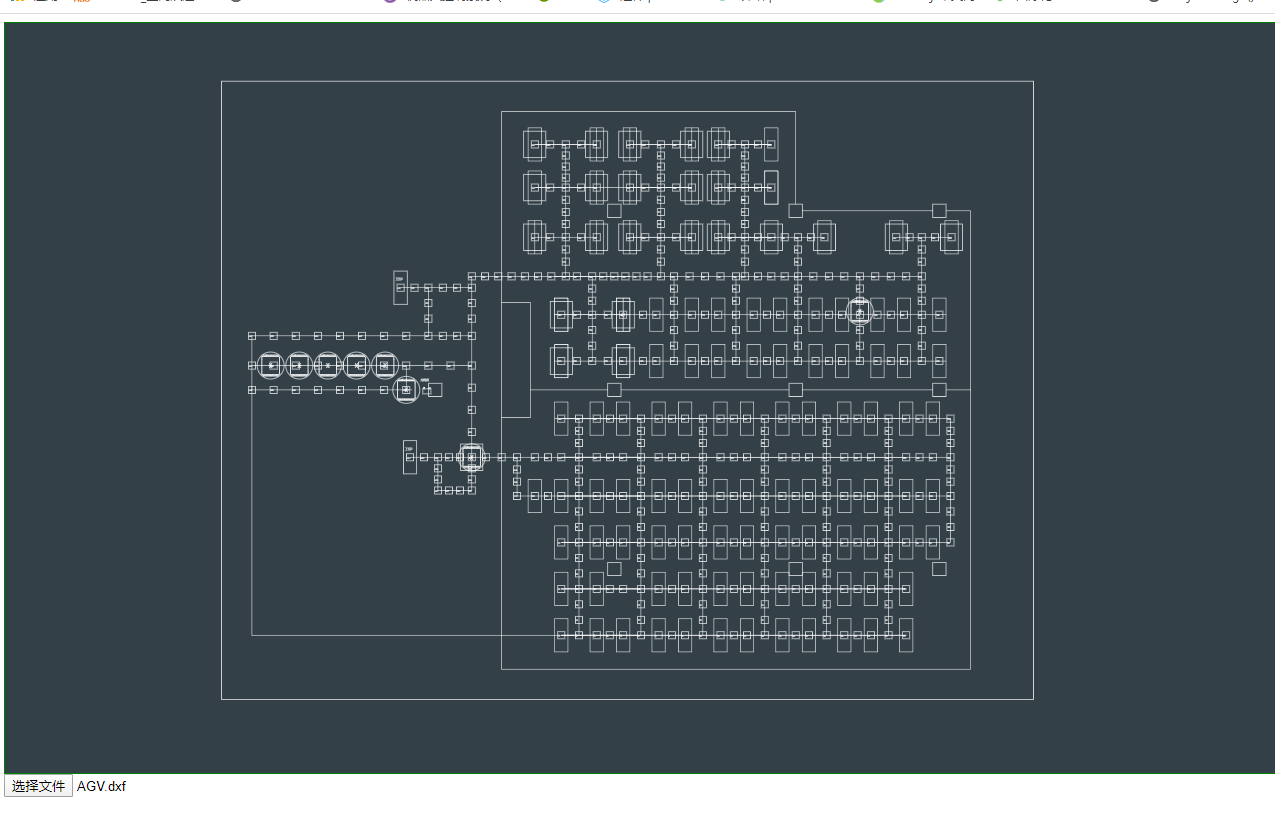
js核心代码:
(function (w) {
    function MapDXF(id, width, height) {
        this.docBind = document.getElementById(id)
        this.width = width
        this.height = height
        this.ctx = undefined // 画笔
        this.docCancas = undefined // 画布
        this.data = undefined // 数据
        this.layer = undefined
        this.coverages = ['mapCanvas'] // 所有图层ID

        // 初始化地图计算数据
        this.scale = 1 // 总图比例
        this.drawScale = 1 // 初始化画地图比列
        this.offsetX = 0 // 画图偏移量
        this.offsetY = 0 // 画图偏移量
        this.margin = 0 // 外边距
        this.drawFuns = [] // 画图方法
        this.cancasWidth = width // 当前画布宽
        this.cancasHeight = height // 当前画布高

        this.mouseX = 0
        this.mouseY = 0
        this.leftX = 0
        this.topY = 0
        this.dragging = false
        this.zoomStepLength = 0.2// 缩放步长
        this.textScale = 1 // 文字对比cad缩放比例
        this.lineWidth = 0.66 // 线宽
        this.lineColor = '#fff'

        this.zoomWidth = 1
        this.translateX = 0
        this.translateY = 0

        this.zoomTranslateX = 0
        this.zoomTranslateY = 0
        // 创建画布
        this._addCanvas()
        // 绑定事件
        this._bind()
    }

    // 给原型扩展方法
    MapDXF.prototype = {

        constructor: MapDXF,
        _addCanvas() {
            // 图层层画地图外面层
            const layer = document.createElement('div')
            layer.id = 'layer'
            layer.style.position = 'absolute'
            layer.classList.add('layer')

            // 画布图层
            const canvas = document.createElement('canvas')
            canvas.id = 'mapCanvas'
            canvas.classList.add('mapCanvas')
            canvas.width = this.width * this.scale
            canvas.height = this.height * this.scale
            layer.appendChild(canvas)

            this.docBind.innerHTML = ''
            this.docBind.appendChild(layer)

            // 初始化画布元素
            this.layer = document.getElementById('layer')
            this.docCancas = document.getElementById('mapCanvas')
            this.ctx = this.docCancas.getContext('2d')
        },

        // ==============缩放及移动逻辑start====================
        // 移动图层
        // 绑定事件
        _bind() {
            const _this = this
            // eslint-disable-next-line space-before-function-paren
            this.docBind.onmousedown = function (event) {
                _this.dragging = true
                _this.mouseX = event.clientX
                _this.mouseY = event.clientY
            }
            // eslint-disable-next-line space-before-function-paren
            this.docBind.onmousemove = function (evt) { // 移动
                if (_this.dragging) {
                    const moveX = evt.clientX - _this.mouseX
                    const moveY = evt.clientY - _this.mouseY
                    _this.mouseX = evt.clientX
                    _this.mouseY = evt.clientY
                    _this.translateX += (moveX / _this.zoomWidth)
                    _this.translateY += (moveY / _this.zoomWidth)

                    _this.draw()
                }
            }
            // eslint-disable-next-line space-before-function-paren
            this.docBind.onmouseup = function () {
                _this.dragging = false
            }
            // eslint-disable-next-line space-before-function-paren
            this.docBind.onmousewheel = this.docBind.onwheel = function (event) { // 滚轮放大缩小
                // 放大缩小思路:计算放大缩小倍数、画线同样放大收缩
                // event.wheelDelta > 0//放大 缩小
                let zoom
                if (event.wheelDelta > 0) {
                    _this.zoomWidth += _this.zoomStepLength
                    zoom = -_this.zoomStepLength
                } else {
                    _this.zoomWidth -= _this.zoomStepLength
                    zoom = _this.zoomStepLength
                    if (_this.zoomWidth <= 0.2) {
                        alert('地图已经最小,无法再缩小')
                        _this.zoomWidth += _this.zoomStepLength
                        return
                    }
                }

                // 移动画布使画布在鼠标处缩放
                const box = _this.docCancas.getBoundingClientRect()
                const x = event.clientX - box.left
                const y = -(_this.docCancas.height - (event.clientY - box.top))

                _this.zoomTranslateX = _this.zoomTranslateX + x * zoom
                _this.zoomTranslateY = _this.zoomTranslateY + y * zoom

                _this.draw()
            }
        },
        // ==============缩放及移动逻辑end====================
        // ==============画地图逻辑start====================
        init(data) {
            this.data = data
            // 初始所有图像都放在地图显示,此时只能放大不能缩小
            // 1.计算最大和最小两点
            // 下基准点取最小坐标,为0,0点
            const minPoint = { x: this.data.MinX, y: this.data.MinY }

            let maxPoint

            const maxY = this.data.MaxX * this.height / this.width
            if (maxY > this.data.MaxY) {
                maxPoint = { x: this.data.MaxX, y: maxY }
            } else {
                maxPoint = { x: this.data.MaxY * this.width / this.height, y: this.data.MaxY }
            }

            // 2.计算比例 (最大点X-最小点X+20预留边距离)
            this.drawScale = this.width / (maxPoint.x - minPoint.x)

            // 3.计算偏移(原点-最小点+边距)
            this.offsetX = 0 - minPoint.x
            this.offsetY = 0 - minPoint.y

            // 添加画图方法
            this.drawFuns = []
            this.drawFuns.Text = this.drawText
            this.drawFuns.Line = this.drawLine
            this.drawFuns.LightWeightPolyline = this.drawLightWeightPolyline
            this.drawFuns.Circle = this.drawCircle

            // 画图
            this.draw()
        },
        // 绘制
        draw(x, y) {
            // 画布原点位置为左上角,将其转换笛卡尔坐标轴
            this.ctx.clearRect(-this.docCancas.width * 500, -this.docCancas.height * 500, this.docCancas.width * 1000, this.docCancas.height * 1000)

            this.ctx.lineWidth = this.lineWidth
            this.ctx.strokeStyle = this.lineColor
            const map = this.data.Map
            map.forEach(e => {
                if (this.drawFuns[e.Type]) {
                    this.drawFuns[e.Type].call(this, e)
                } else {
                    console.log('类型未找到:' + e.Type)
                }
            })
        },
        // 将CAD地图坐标转换为cancas坐标
        convertX(coord) {
            // 1.偏移
            coord = coord + this.offsetX
            let x = this.convert(coord)

            x = x + this.translateX * this.zoomWidth + this.zoomTranslateX

            return x
        },
        convertY(coord) {
            // 1.偏移
            coord = coord + this.offsetY

            const y = this.convert(coord)
            // 计算Y轴偏移及反转
            let yy = this.docCancas.height - y

            yy = yy + this.translateY * this.zoomWidth + this.zoomTranslateY

            return yy
        },
        convert(coord) {
            // 2.初始缩放
            coord = coord * this.drawScale
            // 3.地图缩放
            coord = coord * this.zoomWidth

            return coord
        },
        drawLine(data) {
            const points = data.Points

            this.ctx.beginPath()

            this.ctx.moveTo(this.convertX(points[0].X), this.convertY(points[0].Y))
            this.ctx.lineTo(this.convertX(points[1].X), this.convertY(points[1].Y))
            this.ctx.stroke()
        },
        drawLightWeightPolyline(data) {
            const points = data.Points.slice(0, data.Points.length)

            this.ctx.beginPath()

            this.ctx.moveTo(this.convertX(points[0].X), this.convertY(points[0].Y))
            points.shift()
            points.forEach(e => {
                this.ctx.lineTo(this.convertX(e.X), this.convertY(e.Y))
            })
            if (data.IsClose) {
                this.ctx.closePath()
            }
            this.ctx.stroke()
        },
        drawCircle(data) {
            if (data.Radius > 0) {
                const point = data.Point
                this.ctx.beginPath()
                this.ctx.arc(this.convertX(point.X), this.convertY(point.Y), this.convert(data.Radius), 0, 2 * Math.PI)
                this.ctx.stroke()
            }
        },
        circle() {
            this.ctx.beginPath()
            this.ctx.arc(this.convertX(250), this.convertY(250), 4, 0, 2 * Math.PI)
            this.ctx.arc(this.convertX(0), this.convertY(0), 4, 0, 2 * Math.PI)
            this.ctx.stroke()
        },
        drawText(data) {
            const point = data.Point
            const x = this.convertX(point.X)
            const y = this.convertY(point.Y)

            this.ctx.beginPath()
            this.ctx.font = this.convert(data.Height) * this.textScale + 'px 微软雅黑'
            this.ctx.fillStyle = this.lineColor
            this.ctx.fillText(data.Value, x, y)
            this.ctx.stroke()
        },
        // ==============画地图逻辑end====================
        _getRad(degree) {
            return degree / 180 * Math.PI
        }
    }

    //向外部暴露对象
    w.getMapDXF = function (id, width, height) {
        return new MapDXF(id, width, height)
    }

}(window));

上面为监控添加设备图:代码就不贴了,业务不可能一样。
思路:
1.轨迹用另外一个图层来画。
2.其他设备,放在一个div里面统一管理。
2.1 缩放:地图图层和其他图层共同缩放。
2.2 移动:地图图层和其他图层共同移动。