Pandas基础介绍
Numpy和Pandas有什么不同
如果用 python 的列表和字典来作比较, 那么可以说 Numpy 是列表形式的,没有数值标签,而 Pandas 就是字典形式。Pandas是基于Numpy构建的,让Numpy为中心的应用变得更加简单。
要使用pandas,首先需要了解他主要两个数据结构:Series和DataFrame。
Series
import pandas as pd
import numpy as np
#创建series,索引为默认值
s1=pd.Series([4,7,-5,3])
print(s1)
'''
0    4
1    7
2   -5
3    3
dtype: int64
'''
Series的字符串表现形式为:索引在左边,值在右边。由于我们没有为数据指定索引。于是会自动创建一个0到N-1(N为长度)的整数型索引。
另外,series还有一些方法用于存取:
#series的值
print(s1.values)        #[ 4  7 -5  3]
#series的所有索引
print(s1.index)     #RangeIndex(start=0, stop=4, step=1)

s2=pd.Series([4.0,6.5,-0.5,4.2],index=['d','b','a','c'])
print(s2)
'''
d    4.0
b    6.5
a   -0.5
c    4.2
dtype: float64
'''
#根据索引取值
print(s2['a'])      #-0.5
print(s2[['a','b','c']])
'''
a   -0.5
b    6.5
c    4.2
dtype: float64
'''
#判断索引存在与否
print('b' in s2)        #True

#series可以看成是一个定长的有序字典
dic1={'apple':5,'pen':3,'applepen':10}
s3=pd.Series(dic1)
print(s3)
'''
apple        5
pen          3
applepen    10
dtype: int64
'''
DataFrame
data={
    'year':[2014,2015,2016,2017],
    'income':[10000,20000,30000,40000],
    'pay':[5000,6000,7000,8000]
}

df1=pd.DataFrame(data)
print(df1)
'''
   year  income   pay
0  2014   10000  5000
1  2015   20000  6000
2  2016   30000  7000
3  2017   40000  8000
'''
DataFrame是一个表格型的数据结构,它包含有一组有序的列,每列可以是不同的值类型(数值,字符串,布尔值等)。DataFrame既有行索引也有列索引, 它可以被看做由Series组成的大字典。
我们可以根据每一个不同的索引来挑选数据, 比如挑选 b 的元素:
DataFrame的一些简单运用
重塑矩阵形状:
df2=pd.DataFrame(np.arange(12).reshape((3,4)))
print(df2)
'''
   0  1   2   3
0  0  1   2   3
1  4  5   6   7
2  8  9  10  11
'''
指定表头和索引:
df3=pd.DataFrame(np.arange(12).reshape((3,4)),index=['a','c','b'],columns=[2,3,5,7])
print(df3)
'''
   2  3   5   7
a  0  1   2   3
c  4  5   6   7
b  8  9  10  11
'''
调用行、列、值:
#调用列
print(df1.columns)      #Index(['year', 'income', 'pay'], dtype='object')
#调用行
print(df2.index)        #RangeIndex(start=0, stop=3, step=1)
#调用值
print(df1.values)       #[[ 2014 10000  5000],[ 2015 20000  6000],[ 2016 30000  7000],[ 2017 40000  8000]]

print(df1.describe())
'''
              year        income          pay
count     4.000000      4.000000     4.000000
mean   2015.500000  25000.000000  6500.000000
std       1.290994  12909.944487  1290.994449
min    2014.000000  10000.000000  5000.000000
25%    2014.750000  17500.000000  5750.000000
50%    2015.500000  25000.000000  6500.000000
75%    2016.250000  32500.000000  7250.000000
max    2017.000000  40000.000000  8000.000000
'''
转置、排序:
#转置
print(df1.T)
'''
            0      1      2      3
year     2014   2015   2016   2017
income  10000  20000  30000  40000
pay      5000   6000   7000   8000
'''
#对列进列排序
print(df3.sort_index(axis=1))
'''
   2  3   5   7
a  0  1   2   3
c  4  5   6   7
b  8  9  10  11
'''
#对行进行排序
print(df3.sort_index(axis=0))
'''
   2  3   5   7
a  0  1   2   3
b  8  9  10  11
c  4  5   6   7
'''
#单独对列排序
print(df3.sort_index(by=5))
'''
   2  3   5   7
a  0  1   2   3
c  4  5   6   7
b  8  9  10  11
'''
Pandas选择数据
先建立一个6*4的矩阵数据
import pandas as pd
import numpy as np
dates=pd.date_range('20190101',periods=6)
df1=pd.DataFrame(np.arange(24).reshape((6,4)),index=dates,columns=['A','B','C','D'])
print(df1)
'''
             A   B   C   D
2019-01-01   0   1   2   3
2019-01-02   4   5   6   7
2019-01-03   8   9  10  11
2019-01-04  12  13  14  15
2019-01-05  16  17  18  19
2019-01-06  20  21  22  23
'''
简单的筛选
将DataFrame的列获取为一个series:
#方式1
print(df1['A'])
'''
2019-01-01     0
2019-01-02     4
2019-01-03     8
2019-01-04    12
2019-01-05    16
2019-01-06    20
Freq: D, Name: A, dtype: int32
'''
#方式2
print(df1.A)
取限定的行
#取0-1行
print(df1[0:2])
'''
            A  B  C  D
2019-01-01  0  1  2  3
2019-01-02  4  5  6  7
'''
print(df1['20190101':'20190104'])
'''
            A   B   C   D
2019-01-01   0   1   2   3
2019-01-02   4   5   6   7
2019-01-03   8   9  10  11
2019-01-04  12  13  14  15
'''
根据标签loc
print(df1.loc['20190101'])
'''
A    0
B    1
C    2
D    3
Name: 2019-01-01 00:00:00, dtype: int32
'''
print(df1.loc['20190101',['A','C']])
'''
A    0
C    2
Name: 2019-01-01 00:00:00, dtype: int32
'''
print(df1.loc[:,['A','B']])
'''
             A   B
2019-01-01   0   1
2019-01-02   4   5
2019-01-03   8   9
2019-01-04  12  13
2019-01-05  16  17
2019-01-06  20  21
'''
根据序列 iloc
print(df1.iloc[2])
'''
A     8
B     9
C    10
D    11
Name: 2019-01-03 00:00:00, dtype: int32
'''
#1-3行 2-4列
print(df1.iloc[1:3,2:4])
'''
             C   D
2019-01-02   6   7
2019-01-03  10  11
'''
#指定行列号
print(df1.iloc[[1,2,4],[1,3]])
'''
             B   D
2019-01-02   5   7
2019-01-03   9  11
2019-01-05  17  19
'''
根据混合的这两种 ix
print(df1.ix[2:4,['A','C']])
'''
             A   C
2019-01-03   8  10
2019-01-04  12  14
'''
print(df1.ix['20190102':'20190105',2:4])
'''
             C   D
2019-01-02   6   7
2019-01-03  10  11
2019-01-04  14  15
2019-01-05  18  19
'''
通过判断的筛选
#提取某列作判断
print(df1.A>6)
'''
2019-01-01    False
2019-01-02    False
2019-01-03     True
2019-01-04     True
2019-01-05     True
2019-01-06     True
Freq: D, Name: A, dtype: bool
'''
print(df1[df1.A>6])
'''
             A   B   C   D
2019-01-03   8   9  10  11
2019-01-04  12  13  14  15
2019-01-05  16  17  18  19
2019-01-06  20  21  22  23
'''
Pandas设置值
创建数据
import pandas as pd
import numpy as np
dates=np.arange(20190101,20190107)
df1=pd.DataFrame(np.arange(24).reshape((6,4)),index=dates,columns=['A','B','C','D'])
print(df1)
'''
           A   B   C   D
20190101   0   1   2   3
20190102   4   5   6   7
20190103   8   9  10  11
20190104  12  13  14  15
20190105  16  17  18  19
20190106  20  21  22  23
'''
根据位置设置loc和iloc
#第二行第二列的值
print(df1.iloc[2,2])    #10
#改变值--->用位置
df1.iloc[2,2]=100
print(df1)
'''
           A   B    C   D
20190101   0   1    2   3
20190102   4   5    6   7
20190103   8   9  100  11
20190104  12  13   14  15
20190105  16  17   18  19
20190106  20  21   22  23
'''
#改变值--->用标签
print(df1.loc[20190102,'B'])    #5
df1.loc[20190102,'B']=200
print(df1)
'''
           A    B    C   D
20190101   0    1    2   3
20190102   4  200    6   7
20190103   8    9  100  11
20190104  12   13   14  15
20190105  16   17   18  19
20190106  20   21   22  23
'''
根据条件设置
df1[df1.A>10]=0
print(df1)
'''
          A    B    C   D
20190101  0    1    2   3
20190102  4  200    6   7
20190103  8    9  100  11
20190104  0    0    0   0
20190105  0    0    0   0
20190106  0    0    0   0
'''
df1.A[df1.A==0]=1
print(df1)
'''
          A    B    C   D
20190101  1    1    2   3
20190102  4  200    6   7
20190103  8    9  100  11
20190104  1    0    0   0
20190105  1    0    0   0
20190106  1    0    0   0
'''
按行或列设置
#插入新列
df1['E']=10
print(df1)
'''
          A    B    C   D   E
20190101  1    1    2   3  10
20190102  4  200    6   7  10
20190103  8    9  100  11  10
20190104  1    0    0   0  10
20190105  1    0    0   0  10
20190106  1    0    0   0  10
'''
df1['F']=pd.Series([1,2,3,4,5,6],index=dates)
print(df1)
'''
          A    B    C   D   E  F
20190101  1    1    2   3  10  1
20190102  4  200    6   7  10  2
20190103  8    9  100  11  10  3
20190104  1    0    0   0  10  4
20190105  1    0    0   0  10  5
20190106  1    0    0   0  10  6
'''
添加数据
df1.loc[20190107,['A','B','C',]]=[1,2,3]
print(df1)
'''
            A      B      C     D     E    F
20190101  1.0    1.0    2.0   3.0  10.0  1.0
20190102  4.0  200.0    6.0   7.0  10.0  2.0
20190103  8.0    9.0  100.0  11.0  10.0  3.0
20190104  1.0    0.0    0.0   0.0  10.0  4.0
20190105  1.0    0.0    0.0   0.0  10.0  5.0
20190106  1.0    0.0    0.0   0.0  10.0  6.0
20190107  1.0    2.0    3.0   NaN   NaN  NaN
'''
s1=pd.Series([1,2,3,4,5,6],index=['A','B','C','D','E','F'])
s1.name='S1'
df2=df1.append(s1)
print(df2)
'''
            A      B      C     D     E    F
20190101  1.0    1.0    2.0   3.0  10.0  1.0
20190102  4.0  200.0    6.0   7.0  10.0  2.0
20190103  8.0    9.0  100.0  11.0  10.0  3.0
20190104  1.0    0.0    0.0   0.0  10.0  4.0
20190105  1.0    0.0    0.0   0.0  10.0  5.0
20190106  1.0    0.0    0.0   0.0  10.0  6.0
20190107  1.0    2.0    3.0   NaN   NaN  NaN
S1        1.0    2.0    3.0   4.0   5.0  6.0
'''
#在第一列插入索引为G的df2中的E列
df1.insert(1,'G',df2['E'])
print(df1)
'''
            A     G      B      C     D     E    F
20190101  1.0  10.0    1.0    2.0   3.0  10.0  1.0
20190102  4.0  10.0  200.0    6.0   7.0  10.0  2.0
20190103  8.0  10.0    9.0  100.0  11.0  10.0  3.0
20190104  1.0  10.0    0.0    0.0   0.0  10.0  4.0
20190105  1.0  10.0    0.0    0.0   0.0  10.0  5.0
20190106  1.0  10.0    0.0    0.0   0.0  10.0  6.0
20190107  1.0   NaN    2.0    3.0   NaN   NaN  NaN
'''
#移动位置
g=df1.pop('G')   #弹出G列
df1.insert(6,'G',g) #在最后插入
print(df1)
'''
            A      B      C     D     E    F     G
20190101  1.0    1.0    2.0   3.0  10.0  1.0  10.0
20190102  4.0  200.0    6.0   7.0  10.0  2.0  10.0
20190103  8.0    9.0  100.0  11.0  10.0  3.0  10.0
20190104  1.0    0.0    0.0   0.0  10.0  4.0  10.0
20190105  1.0    0.0    0.0   0.0  10.0  5.0  10.0
20190106  1.0    0.0    0.0   0.0  10.0  6.0  10.0
20190107  1.0    2.0    3.0   NaN   NaN  NaN   NaN
'''
删除数据
#删除列
del df1['G']
print(df1)
'''
            A      B      C     D     E    F
20190101  1.0    1.0    2.0   3.0  10.0  1.0
20190102  4.0  200.0    6.0   7.0  10.0  2.0
20190103  8.0    9.0  100.0  11.0  10.0  3.0
20190104  1.0    0.0    0.0   0.0  10.0  4.0
20190105  1.0    0.0    0.0   0.0  10.0  5.0
20190106  1.0    0.0    0.0   0.0  10.0  6.0
20190107  1.0    2.0    3.0   NaN   NaN  NaN
'''
df2=df1.drop(['A','B'],axis=1)  #删除AB列
print(df2)
'''
              C     D     E    F
20190101    2.0   3.0  10.0  1.0
20190102    6.0   7.0  10.0  2.0
20190103  100.0  11.0  10.0  3.0
20190104    0.0   0.0  10.0  4.0
20190105    0.0   0.0  10.0  5.0
20190106    0.0   0.0  10.0  6.0
20190107    3.0   NaN   NaN  NaN
'''
df2=df1.drop([20190101,20190102],axis=0)
print(df2)
'''
            A    B      C     D     E    F
20190103  8.0  9.0  100.0  11.0  10.0  3.0
20190104  1.0  0.0    0.0   0.0  10.0  4.0
20190105  1.0  0.0    0.0   0.0  10.0  5.0
20190106  1.0  0.0    0.0   0.0  10.0  6.0
20190107  1.0  2.0    3.0   NaN   NaN  NaN
'''
Pandas处理丢失数据
创建含NaN的矩阵
import pandas as pd
import numpy as np
dates=np.arange(20190101,20190105)
df1=pd.DataFrame(np.arange(12).reshape((4,3)),index=dates,columns=['A','B','C'])
print(df1)
'''
          A   B   C
20190101  0   1   2
20190102  3   4   5
20190103  6   7   8
20190104  9  10  11
'''
df2=pd.DataFrame(df1,index=dates,columns=['A','B','C','D','E'])
print(df2)
'''
          A   B   C   D   E
20190101  0   1   2 NaN NaN
20190102  3   4   5 NaN NaN
20190103  6   7   8 NaN NaN
20190104  9  10  11 NaN NaN
'''
嵌套:
s1=pd.Series([3,4,6],index=dates[:3])
s2=pd.Series([32,5,2],index=dates[1:])

df2['D']=s1
df2['E']=s2
print(df2)
'''
          A   B   C    D     E
20190101  0   1   2  3.0   NaN
20190102  3   4   5  4.0  32.0
20190103  6   7   8  6.0   5.0
20190104  9  10  11  NaN   2.0
'''
pd.dropna()
#axis=0 or 1 0代表行,1带代表列 how=any or all any代表任意 all代表全部
print(df2.dropna(axis=0,how='any'))
'''
          A  B  C    D     E
20190102  3  4  5  4.0  32.0
20190103  6  7  8  6.0   5.0
'''
pd.fillna()
#把空值赋值为0
print(df2.fillna(value=0))
'''
          A   B   C    D     E
20190101  0   1   2  3.0   0.0
20190102  3   4   5  4.0  32.0
20190103  6   7   8  6.0   5.0
20190104  9  10  11  0.0   2.0
'''
pd.isnull()
#查看空值
print(df2.isnull())
'''
              A      B      C      D      E
20190101  False  False  False  False   True
20190102  False  False  False  False  False
20190103  False  False  False  False  False
20190104  False  False  False   True  False
'''
#判断一张表中是否有空值--->只要有一个或多个空值就返回TRUE
print(np.any(df2.isnull()))     #True
#所有值为空值才返回TRUE
print(np.all(df2.isnull()))     #False
Pandas导入导出
要点
pandas可以读取与存取的资料格式有很多种,像csv、excel、json、html与pickle等…
读取CSV
import pandas as pd #加载模块

#读取csv
data = pd.read_csv('student.csv')

#打印出data
print(data)
将资料存取成pickle
data.to_pickle('student.pickle')
Pandas合并 concat
#横向合并,index使用df1的index
df8=pd.concat([df1,df2],axis=1,join_axes=[df1.index])
print(df8)
'''
   a  b   c   f   a   c   d
0  0  1   2   3  12  13  14
1  4  5   6   7  15  16  17
2  8  9  10  11  18  19  20
'''
df8=pd.concat([df1,df2],axis=1)
print(df8)
'''
     a    b     c     f   a   c   d
0  0.0  1.0   2.0   3.0  12  13  14
1  4.0  5.0   6.0   7.0  15  16  17
2  8.0  9.0  10.0  11.0  18  19  20
3  NaN  NaN   NaN   NaN  21  22  23
'''
Pandas合并 merge
先建表:
import pandas as pd
import numpy as np
left=pd.DataFrame({'key':['k0','k1','k2','k3'],
                   'A':['A0','A1','A2','A3'],
                   'B':['B0','B1','B2','B3']})
right=pd.DataFrame({'key':['k0','k1','k2','k3'],
                    'C':['C0','C1','C2','C3'],
                    'D':['D0','D1','D2','D3']})
print(left)
'''
  key   A   B
0  k0  A0  B0
1  k1  A1  B1
2  k2  A2  B2
3  k3  A3  B3
'''
print(right)
'''
  key   C   D
0  k0  C0  D0
1  k1  C1  D1
2  k2  C2  D2
3  k3  C3  D3
'''
合并:
res=pd.merge(left,right,on=['key1','key2'],how='outer') #how=left or right or inner or outer   默认为inner
print(res)
'''
key1 key2    A    B    C    D
0   k0   k0   A0   B0   C0   D0
1   k0   k1   A1   B1  NaN  NaN
2   k2   k0   A2   B2  NaN  NaN
3   k3   k1   A3   B3  NaN  NaN
4   k1   k0  NaN  NaN   C1   D1
5   k1   k0  NaN  NaN   C2   D2
6   k3   k0  NaN  NaN   C3   D3
'''
res=pd.merge(left,right,on=['key1','key2'],how='inner') #how=left or right or inner or outer   默认为inner
print(res)
'''
  key1 key2   A   B   C   D
0   k0   k0  A0  B0  C0  D0
'''
res=pd.merge(left,right,on=['key1','key2'],how='outer',indicator=True) #how=left or right or inner or outer   默认为inner
print(res)
'''
  key1 key2    A    B    C    D      _merge
0   k0   k0   A0   B0   C0   D0        both
1   k0   k1   A1   B1  NaN  NaN   left_only
2   k2   k0   A2   B2  NaN  NaN   left_only
3   k3   k1   A3   B3  NaN  NaN   left_only
4   k1   k0  NaN  NaN   C1   D1  right_only
5   k1   k0  NaN  NaN   C2   D2  right_only
6   k3   k0  NaN  NaN   C3   D3  right_only
'''

left=pd.DataFrame({'A':['A0','A1','A2'],
                   'B':['B0','B1','B2']},
                   index=['K0','K1','K2'])
right=pd.DataFrame({'C':['C0','C2','C3'],
                    'D':['D0','D2','D3']},
                   index=['K0','K2','K3'])
print(left)
'''
     A   B
K0  A0  B0
K1  A1  B1
K2  A2  B2
'''
print(right)
'''
     C   D
K0  C0  D0
K2  C2  D2
K3  C3  D3
'''
res=pd.merge(left,right,left_index=True,right_index=True,how='outer')
print(res)
'''
      A    B    C    D
K0   A0   B0   C0   D0
K1   A1   B1  NaN  NaN
K2   A2   B2   C2   D2
K3  NaN  NaN   C3   D3
'''
boys=pd.DataFrame({'k':['K0','K1','K2'],'age':[1,2,3]})
girls=pd.DataFrame({'k':['K0','K0','K3'],'age':[4,5,6]})
print(boys)
'''
    k  age
0  K0    1
1  K1    2
2  K2    3
'''
print(girls)
'''
    k  age
0  K0    4
1  K0    5
2  K3    6
'''
res=pd.merge(boys,girls,on='k',suffixes=['_boys','_girls'],how='outer')
print(res)
'''
    k  age_boys  age_girls
0  K0       1.0        4.0
1  K0       1.0        5.0
2  K1       2.0        NaN
3  K2       3.0        NaN
4  K3       NaN        6.0
'''
Pandas plot出图
这次我们讲如何将数据可视化. 首先import我们需要用到的模块,除了 pandas,我们也需要使用 numpy 生成一些数据,这节里使用的 matplotlib 仅仅是用来 show 图片的, 即 plt.show()。
import pandas as pd
import numpy as np
import matplotlib.pyplot as plt
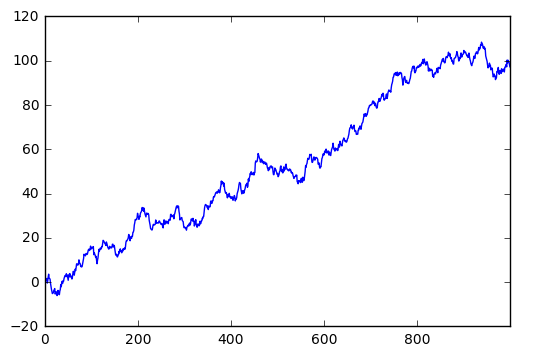
创建一个Series
这是一个线性的数据,我们随机生成1000个数据,Series 默认的 index 就是从0开始的整数,但是这里我显式赋值以便让大家看的更清楚。
# 随机生成1000个数据
data = pd.Series(np.random.randn(1000),index=np.arange(1000))

# 为了方便观看效果, 我们累加这个数据
data.cumsum()

# pandas 数据可以直接观看其可视化形式
data.plot()

plt.show()
就这么简单,熟悉 matplotlib 的朋友知道如果需要plot一个数据,我们可以使用 plt.plot(x=, y=),把x,y的数据作为参数存进去,但是data本来就是一个数据,所以我们可以直接plot。 生成的结果就是下图:
DataFrame可视化
我们生成一个1000*4 的DataFrame,并对他们累加
data = pd.DataFrame(
    np.random.randn(1000,4),
    index=np.arange(1000),
    columns=list("ABCD")
    )
data.cumsum()
data.plot()
plt.show()

这个就是我们刚刚生成的4个column的数据,因为有4组数据,所以4组数据会分别plot出来。plot 可以指定很多参数,具体的用法大家可以自己查一下这里除了plot,我经常会用到还有scatter,这个会显示散点图,首先给大家说一下在 pandas 中有多少种方法
- bar
- hist
- box
- kde
- area
- scatter
- hexbin
但是我们今天不会一一介绍,主要说一下 plot 和 scatter. 因为scatter只有x,y两个属性,我们我们就可以分别给x, y指定数据
ax = data.plot.scatter(x='A',y='B',color='DarkBlue',label='Class1')
然后我们在可以再画一个在同一个ax上面,选择不一样的数据列,不同的 color 和 label
# 将之下这个 data 画在上一个 ax 上面
data.plot.scatter(x='A',y='C',color='LightGreen',label='Class2',ax=ax)
plt.show()
