这是我在逛 Stack Overflow 时遇见的一个高分问题:Why is processing a sorted array faster than an unsorted array?,我觉得这是一个非常好的用来讲分支预测(Branch Prediction)的例子,分享给大家看看
一、问题引入
先看这个代码:
#include <algorithm>
#include <ctime>
#include <iostream>
#include <stdint.h>

int main() {
    uint32_t arraySize = 20000;
    uint32_t data[arraySize];

    for (uint32_t i = 0; i < arraySize; ++ i) {
        data[i] = std::rand() % 256;
    }

    // !!! With this, the next loop runs faster
    std::sort(data, data + arraySize);

    clock_t start = clock();
    uint64_t sum = 0;
    for (uint32_t cnt = 0; cnt < 100000; ++ cnt) {
        for (uint32_t i = 0; i < arraySize; ++ i) {
            if (data[i] > 128) {
                sum += data[i];
            }
        }
    }

    double processTime = static_cast<double>(clock() - start) / CLOCKS_PER_SEC;

    std::cout << "processTime: " << processTime << std::endl;
    std::cout << "sum: " << sum << std::endl;

    return 0;
};
注意:这里特地没有加随机数种子是为了确保 data 数组中的伪随机数始终不变,为接下来的对比分析做准备,尽可能减少实验中的变量
我们编译并运行这段代码(gcc 版本 4.1.2,太高的话会被优化掉):
$ g++ a.cpp -o a -O3
$ ./a
processTime: 1.78
sum: 191444000000
下面,把下面的这一行注释掉,然后再编译并运行:
std::sort(data, data + arraySize);
$ g++ a.cpp -o b -O3
$ ./b
processTime: 10.06
sum: 191444000000
注意到了吗?去掉那一行排序的代码后,整个计算时间被延长了十倍!
二、是 Cache Miss 导致的吗?
答案显然是否定的。cache miss 率并不会因为数组是否排序而改变,因为两份代码取数据的顺序是一样的,数据量大小是一样的,数据布局也是一样的,并且在同一台机器上运行,并没有任何差别,所以可以肯定的是:和 cache miss 无任何关系
为了验证我们的分析,可以用 valgrind 提供的 cachegrind tool 查看 cache miss 率:
$ valgrind --tool=cachegrind ./a
==26548== Cachegrind, a cache and branch-prediction profiler
==26548== Copyright (C) 2002-2015, and GNU GPL'd, by Nicholas Nethercote et al.
==26548== Using Valgrind-3.11.0 and LibVEX; rerun with -h for copyright info
==26548== Command: ./a
==26548==
--26548-- warning: L3 cache found, using its data for the LL simulation.
--26548-- warning: specified LL cache: line_size 64  assoc 20  total_size 15,728,640
--26548-- warning: simulated LL cache: line_size 64  assoc 30  total_size 15,728,640
processTime: 68.57
sum: 191444000000
==26548==
==26548== I   refs:      14,000,637,620
==26548== I1  misses:             1,327
==26548== LLi misses:             1,293
==26548== I1  miss rate:           0.00%
==26548== LLi miss rate:           0.00%
==26548==
==26548== D   refs:       2,001,434,596  (2,000,993,511 rd   + 441,085 wr)
==26548== D1  misses:       125,115,133  (  125,112,303 rd   +   2,830 wr)
==26548== LLd misses:             7,085  (        4,770 rd   +   2,315 wr)
==26548== D1  miss rate:            6.3% (          6.3%     +     0.6%  )
==26548== LLd miss rate:            0.0% (          0.0%     +     0.5%  )
==26548==
==26548== LL refs:          125,116,460  (  125,113,630 rd   +   2,830 wr)
==26548== LL misses:              8,378  (        6,063 rd   +   2,315 wr)
==26548== LL miss rate:             0.0% (          0.0%     +     0.5%  )
$ valgrind --tool=cachegrind ./b
==13898== Cachegrind, a cache and branch-prediction profiler
==13898== Copyright (C) 2002-2015, and GNU GPL'd, by Nicholas Nethercote et al.
==13898== Using Valgrind-3.11.0 and LibVEX; rerun with -h for copyright info
==13898== Command: ./b
==13898==
--13898-- warning: L3 cache found, using its data for the LL simulation.
--13898-- warning: specified LL cache: line_size 64  assoc 20  total_size 15,728,640
--13898-- warning: simulated LL cache: line_size 64  assoc 30  total_size 15,728,640
processTime: 76.7
sum: 191444000000
==13898==
==13898== I   refs:      13,998,930,559
==13898== I1  misses:             1,316
==13898== LLi misses:             1,281
==13898== I1  miss rate:           0.00%
==13898== LLi miss rate:           0.00%
==13898==
==13898== D   refs:       2,000,938,800  (2,000,663,898 rd   + 274,902 wr)
==13898== D1  misses:       125,010,958  (  125,008,167 rd   +   2,791 wr)
==13898== LLd misses:             7,083  (        4,768 rd   +   2,315 wr)
==13898== D1  miss rate:            6.2% (          6.2%     +     1.0%  )
==13898== LLd miss rate:            0.0% (          0.0%     +     0.8%  )
==13898==
==13898== LL refs:          125,012,274  (  125,009,483 rd   +   2,791 wr)
==13898== LL misses:              8,364  (        6,049 rd   +   2,315 wr)
==13898== LL miss rate:             0.0% (          0.0%     +     0.8%  )
对比可以发现,他们俩的 cache miss rate 和 cache miss 数几乎相同,因此确实和 cache miss 无关
三、Branch Prediction
使用到 valgrind 提供的 callgrind tool 可以查看分支预测失败率:
$ valgrind --tool=callgrind --branch-sim=yes ./a
==29373== Callgrind, a call-graph generating cache profiler
==29373== Copyright (C) 2002-2015, and GNU GPL'd, by Josef Weidendorfer et al.
==29373== Using Valgrind-3.11.0 and LibVEX; rerun with -h for copyright info
==29373== Command: ./a
==29373==
==29373== For interactive control, run 'callgrind_control -h'.
processTime: 288.68
sum: 191444000000
==29373==
==29373== Events    : Ir Bc Bcm Bi Bim
==29373== Collected : 14000637633 4000864744 293254 23654 395
==29373==
==29373== I   refs:      14,000,637,633
==29373==
==29373== Branches:       4,000,888,398  (4,000,864,744 cond + 23,654 ind)
==29373== Mispredicts:          293,649  (      293,254 cond +    395 ind)
==29373== Mispred rate:             0.0% (          0.0%     +    1.7%   )
可以看到,在计算 sum 之前对数组排序,分支预测失败率非常低,几乎相当于没有失败
$ valgrind --tool=callgrind --branch-sim=yes ./b
==23202== Callgrind, a call-graph generating cache profiler
==23202== Copyright (C) 2002-2015, and GNU GPL'd, by Josef Weidendorfer et al.
==23202== Using Valgrind-3.11.0 and LibVEX; rerun with -h for copyright info
==23202== Command: ./b
==23202==
==23202== For interactive control, run 'callgrind_control -h'.
processTime: 287.12
sum: 191444000000
==23202==
==23202== Events    : Ir Bc Bcm Bi Bim
==23202== Collected : 13998930783 4000477534 1003409950 23654 395
==23202==
==23202== I   refs:      13,998,930,783
==23202==
==23202== Branches:       4,000,501,188  (4,000,477,534 cond + 23,654 ind)
==23202== Mispredicts:    1,003,410,345  (1,003,409,950 cond +    395 ind)
==23202== Mispred rate:            25.1% (         25.1%     +    1.7%   )
而这个未排序的就不同了,分支预测失败率达到了 25%。因此可以确定的是:两份代码在运行时 CPU 分支预测失败率不同导致了运行时间的不同
四、分支预测
那么到底什么是分支预测,分支预测的策略是什么呢?这两个问题我觉得 Mysticial 的回答 解释的非常好:
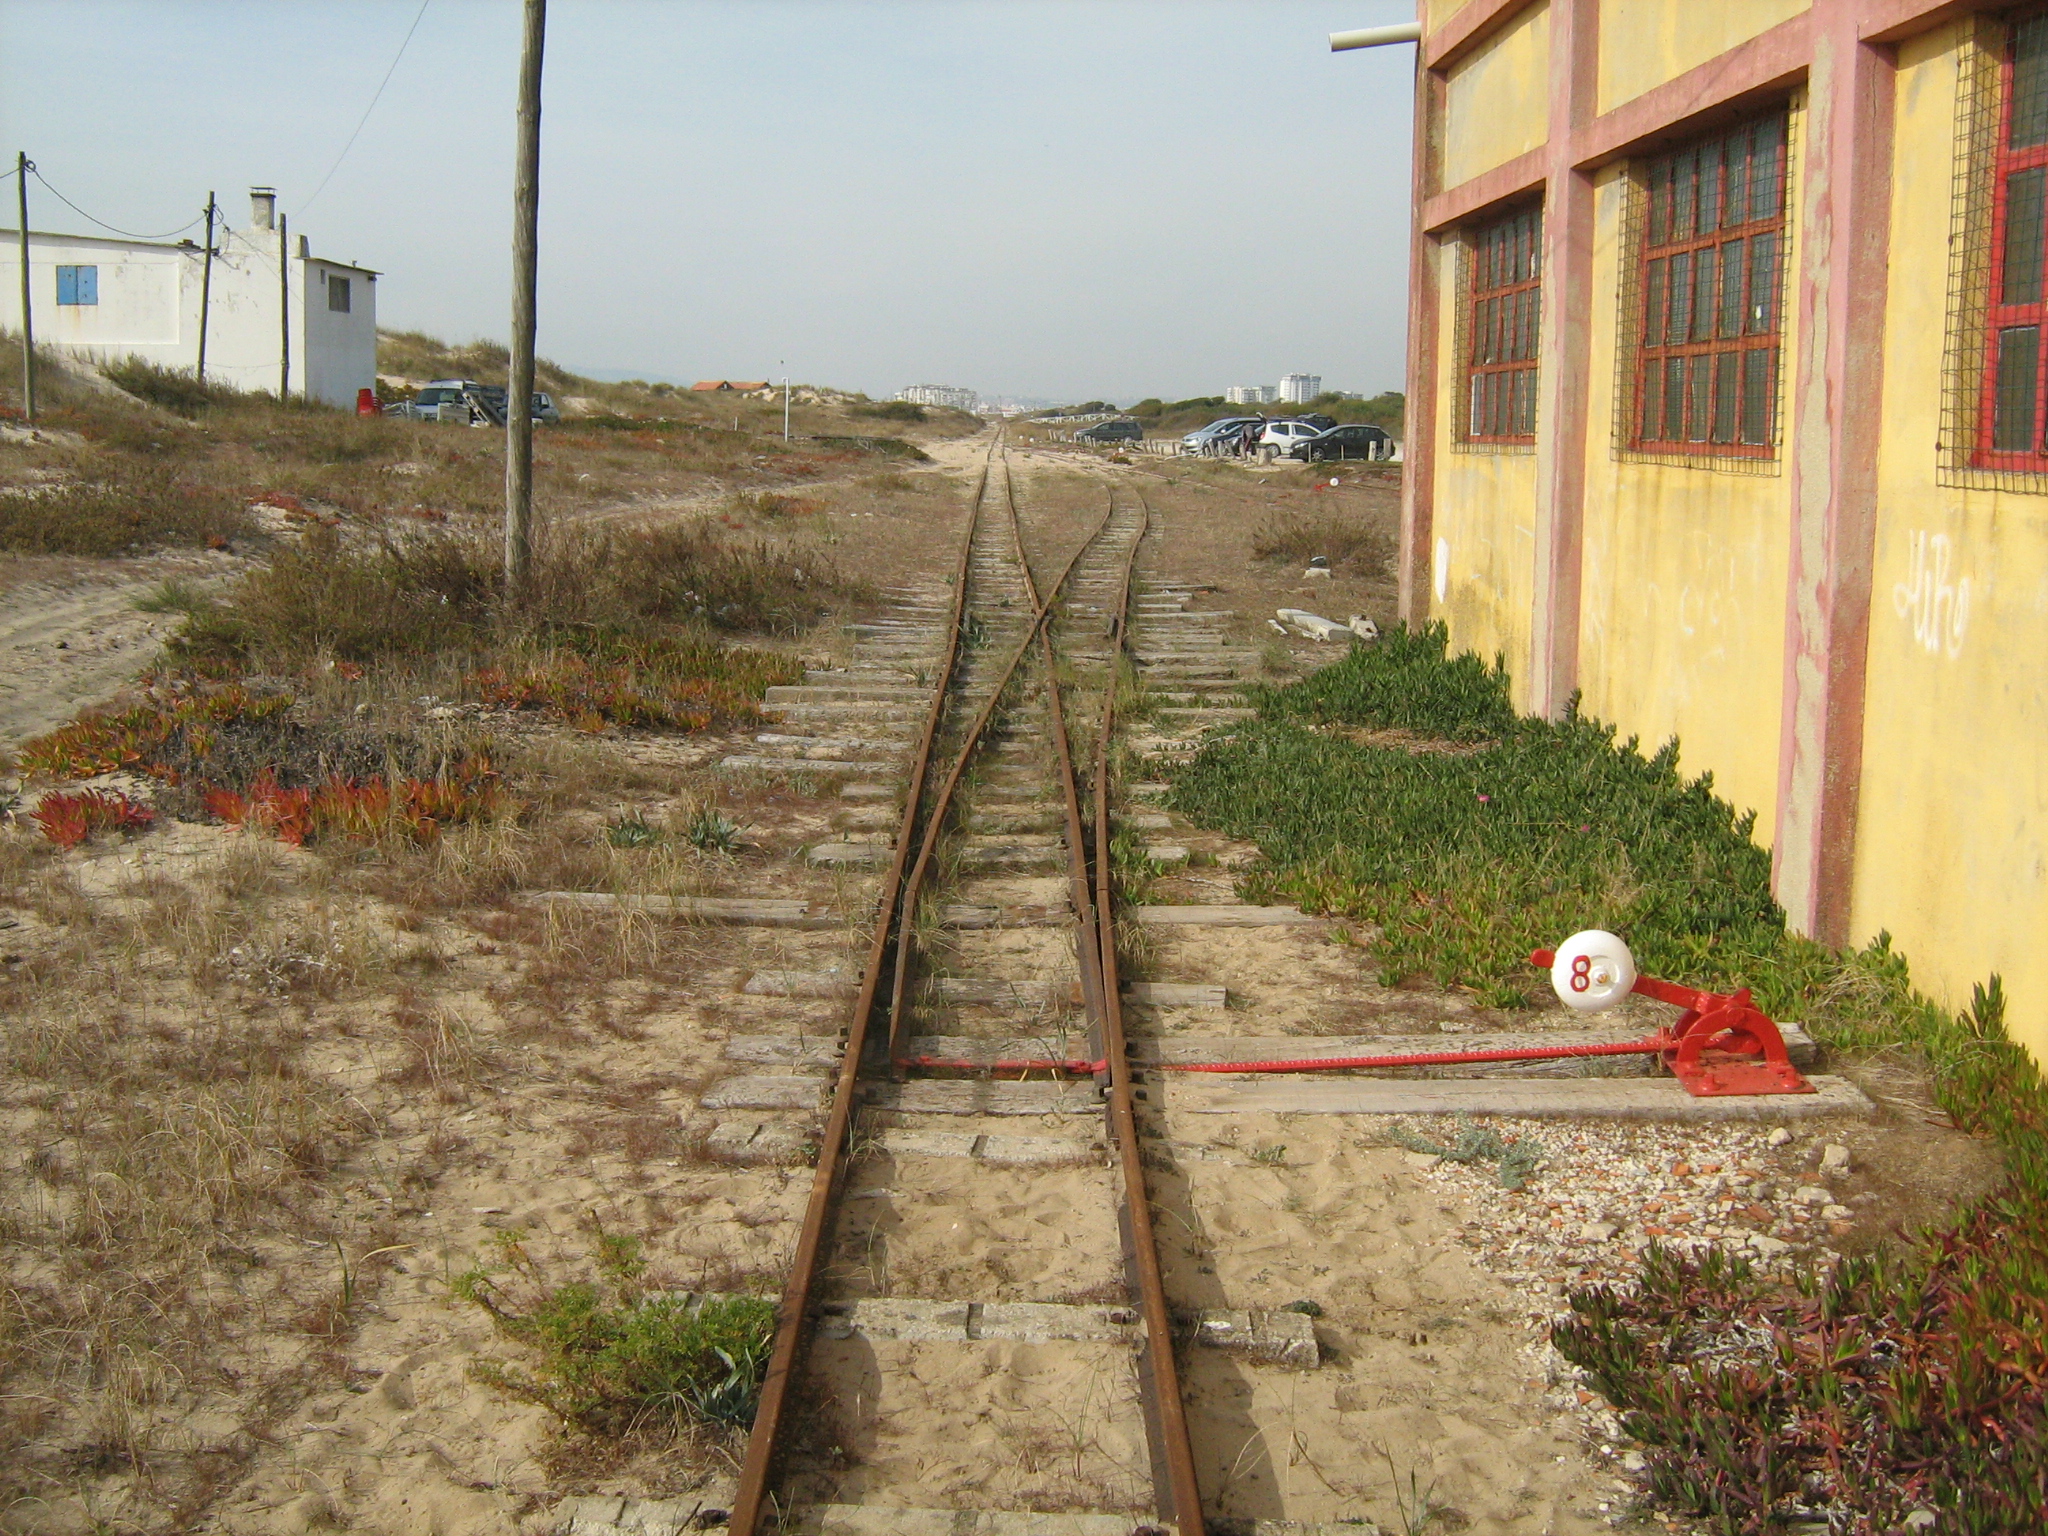
假设我们现在处于 1800 年代,那会长途通信或者无线通信还没有出现。你是某个铁路分叉口的操作员,当你正在打盹的时候,远方传来了火车轰隆隆的声音。你知道又有一辆列车开过来了,但是你不知道它要走哪条路,因此列车不得不停下来,在得知它要去哪个方向后,你把开关拨向正确的位置,列车缓缓启动驶向远方。
但是列车很重,自身的惯性很大,停止和启动都需要花很长很长的时间。有什么方法能让列车更快的到达目的地吗?有:你来猜测列车将驶向哪个方向。
如果你猜中了,列车继续前进;如果没有猜中:司机发现路不对后刹车、倒车、冲你发一顿火,最后你把开关拨到另一边,然后司机启动列车,走另一条路。
现在让我们来看看那条 if 语句:
if (data[i] >= 128) {
    sum += data[i]
}
现在假设你是 CPU,当遇到这个 if 语句时,接下来该做什么:把 data[i] 累加到 sum 上面还是什么都不做?
怎么办?难道是暂停下来,等待 if 表达式算出结果,如果是 true 就执行 sum += data[i],否则什么也不做?
经过几十年的发展,现代处理器异常复杂并拥有者超长的 pipeline,它需要花费很长的时间“暂停”和重新执行命令,为了加快执行速度,处理器需要猜测接下来要做什么,也就是说:你先忽略 if 表达式的结果,让它一边算去,你选择其中一个分支继续执行下去。
如果你猜对了,程序继续执行;如果猜错了,需要 flush pipeline、回滚到分支判断那、选择另一个分支执行下去。
如果每次都猜中:程序执行过程中永远不会出现中途暂停的情况
如果大多数都猜错了:你将消耗大量的时间在“暂停、回滚、重新执行”上面
这就是分支预测。那么 CPU 在猜测接下来要执行哪个分支时有什么策略吗?当然是根据已有的经验啦:根据历史经验寻找一个模式
如果过去 99% 的火车都走了左边,你就猜测下次火车到来还是会走左边;如果是左右交替着走,那么每次火车来的时候你把开关拨向另一边就可以了;如果每三辆车走右边后会有一辆车走左边,那么你也对应的猜测并操作开关...
也就是说:从火车的行进方向历史中找到一个固有的模式,然后按照这个模式猜测下次火车将走哪个方向。这种工作方式和处理器的分支预测器非常相似
大多数应用程序都有表现良好的分支选择(让 CPU 有迹可循)模式,因此现代分支预测器基本上都有着 90% 以上的命中率。但是当面临有着无法识别的分支选择模式时,分支预测器的命中率极度低下,毫无可用性可言,比如上面未排序的随机数组 data
关于分支预测的更多解释,感兴趣的话大家可以看看维基百科的解释:Branch predictor