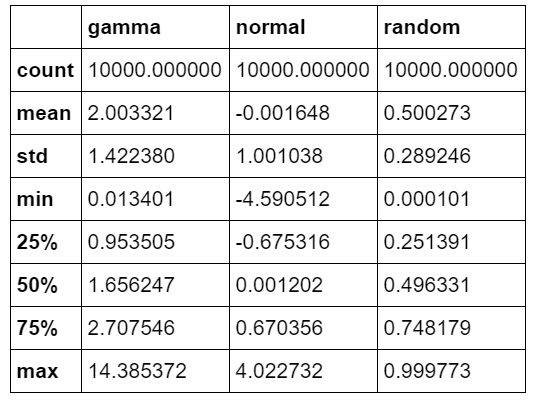
 1 import pandas as pd
 2 normal_sample = np.random.normal(loc=0.0, scale=1.0, size=10000)
 3 random_sample = np.random.random(size=10000)
 4 gamma_sample = np.random.gamma(2, size=10000)
 5
 6 #创建新的数据格式
 7 df = pd.DataFrame({'normal': normal_sample,
 8                    'random': random_sample,
 9                    'gamma': gamma_sample})
10
11 df.describe()
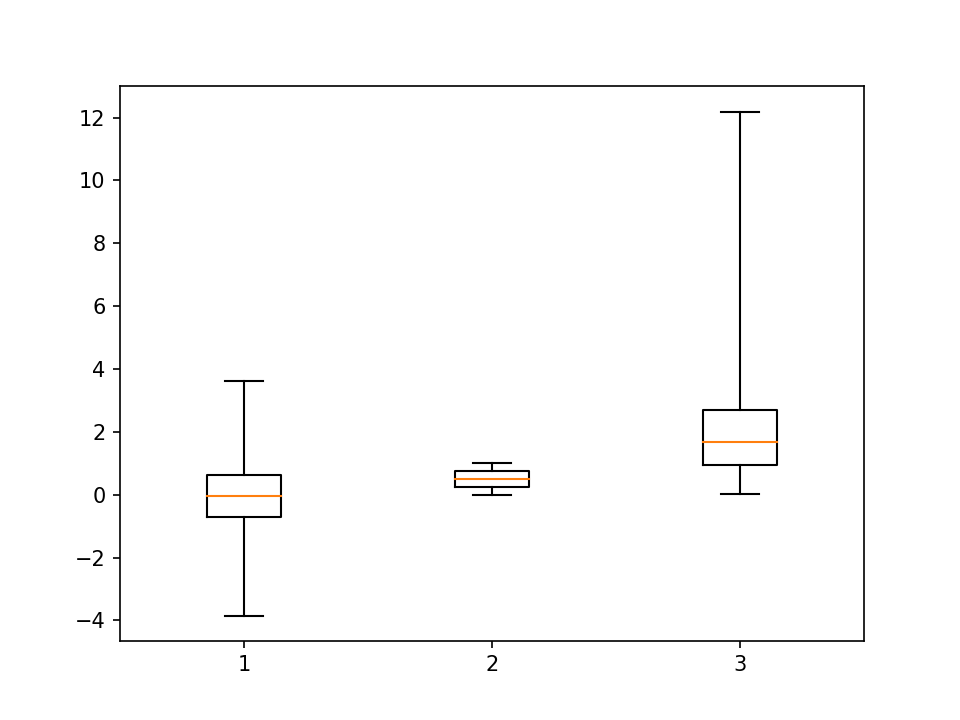
1 plt.figure()
2 # 画normal的箱型图
3 _ = plt.boxplot(df['normal'], whis='range')
4
5
6 # 清空图像
7 plt.clf()
8 # 同时画normal,random,gamma的箱型图
9 _ = plt.boxplot([ df['normal'], df['random'], df['gamma'] ], whis='range')
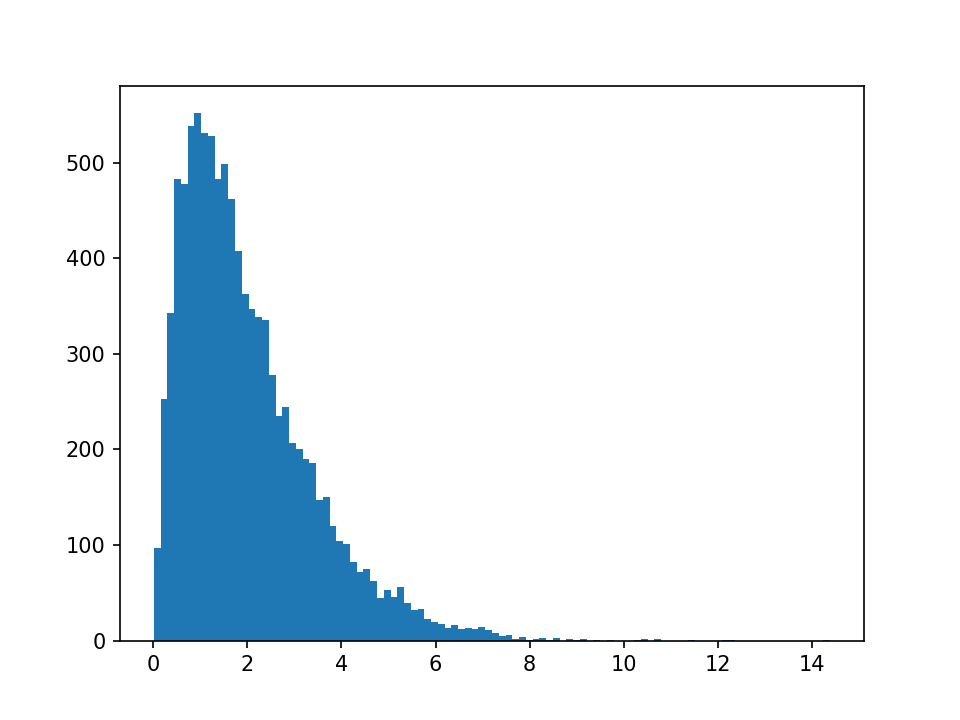
1 plt.figure()
2 _ = plt.hist(df['gamma'], bins=100)
1 import mpl_toolkits.axes_grid1.inset_locator as mpl_il
2
3 plt.figure()
 现在图上画出normal,random,gamma的箱型图
4 plt.boxplot([ df['normal'], df['random'], df['gamma'] ], whis='range')
5 # 在图的右上角得到一块区域画拟合图
6 ax2 = mpl_il.inset_axes(plt.gca(), width='60%', height='40%', loc=2)
7 ax2.hist(df['gamma'], bins=100)
8 ax2.margins(x=0.5)
1 # 把左边的y轴坐标的标注移到右边
2 ax2.yaxis.tick_right()

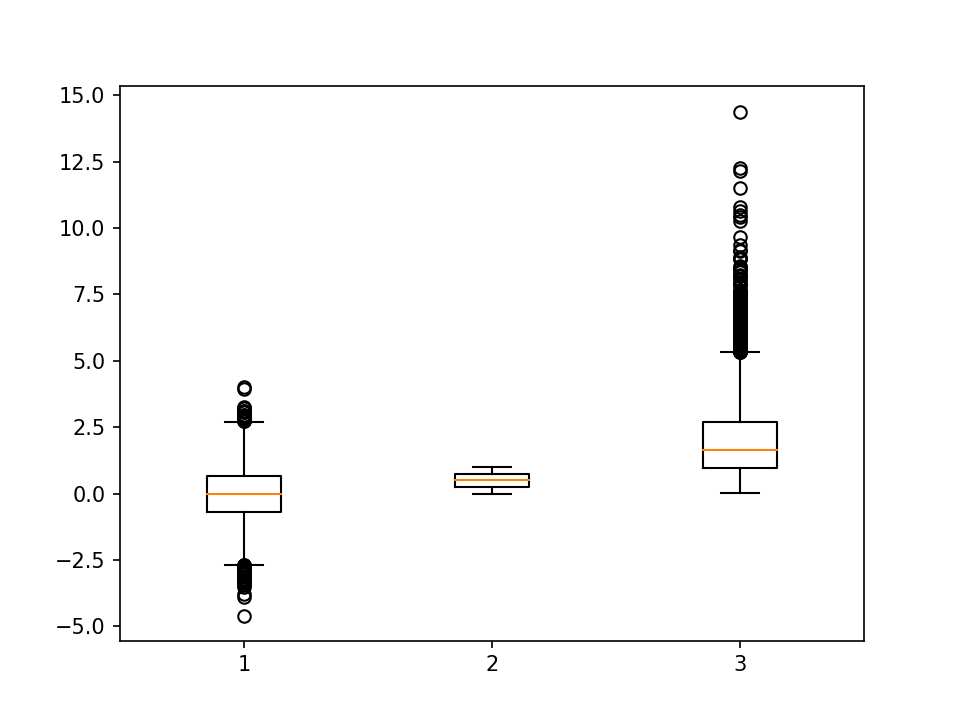
1 # if `whis` argument isn't passed, boxplot defaults to showing 1.5*interquartile (IQR) whiskers with outliers
2 plt.figure()
3 _ = plt.boxplot([ df['normal'], df['random'], df['gamma'] ] )