1. Introduction
Knowledge graphs have emerged as a compelling abstraction for organizing world's structured knowledge over the internet, and a way to integrate information extracted from multiple data sources. Knowledge graphs have also started to play a central role in machine learning as a method to incorporate world knowledge, as a target knowledge representation for extracted knowledge, and for explaining what is learned.
知识图谱已经成为在互联网上组织现实世界结构化知识的一种引人注目的抽象表示,也是整合从多个数据源中提取的信息的一种方式。知识图谱也开始在机器学习中发挥核心作用,作为一种表达现实世界知识的方法,作为对提取的知识进行目标知识表示,并用于解释所学到的东西。
Our goal here is to explain the basic terminology, concepts and usage of knowledge graphs in a simple to understand manner. We do not intend to give here an exhaustive survey of the past and current work on the topic of knowledge graphs.
我们这里的目标是以简单易懂的方式解释知识图的基本术语、概念和用法。我们不打算在此对过去和现在关于知识图谱相关话题的工作做详尽的调查。
We will begin by defining knowledge graphs, some applications that have contributed to the recent surge in the popularity of knowledge graphs, and then use of knowledge graphs in machine learning. We will conclude this chapter by summarizing what is new and different about the recent use of knowledge graphs.
我们将从定义知识图谱开始,介绍一些促成最近知识图谱流行的应用,然后在机器学习中使用知识图谱。我们将通过总结最近使用的知识图谱有什么新的和不同的来得出结论本章。
2. Knowledge Graph Definition
A knowledge graph is a directed labeled graph in which the labels have well-defined meanings. A directed labeled graph consists of nodes, edges, and labels. Anything can act as a node, for example, people, company, computer, etc. An edge connects a pair of nodes and captures the relationship of interest between them, for example, friendship relationship between two people, customer relationship between a company and person, or a network connection between two computers. The labels capture the meaning of the relationship, for example, the friendship relationship between two people.
知识图是一个有向标记图,其中的标记具有定义良好的意义。有向标记图由节点、边和标记组成。任何事物都可以充当节点,例如人、公司、计算机等。一条边连接一对节点,捕捉它们之间的利益关系,例如,两人之间的友谊关系、公司与人之间的客户关系,或者两台计算机之间的网络连接。标签捕捉了关系的含义,例如两个人之间的友谊关系。
More formally, given a set of nodes N, and a set of labels L, a knowledge graph is a subset of the cross product N × L × N. Each member of this set is referred to as a triple, and can be visualized as shown below.
更正式的说,给定一组节点N和一组标签L ,知识图谱是交叉积 N×L×N 的子集,该集合的每个成员被称为三元组,可可视化如下所示。
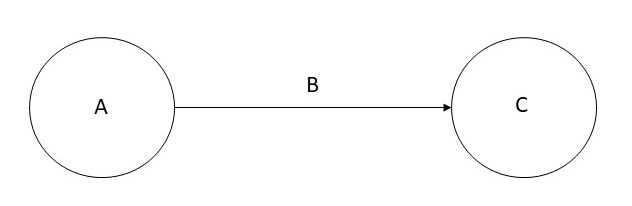
The directed graph representation is used in a variety of ways depending on the needs of an application. A directed graphs such as the one in which the nodes are people, and the edges capture friendship relationship is also known as a data graph. A directed graph in which the nodes are classes of objects (e.g., Book, Textbook, etc.), and the edges capture the subclass relationship, is also known as a taxonomy. In some data models, A is referred to as subject, B is referred to as predicate, and C is referred to as object.
根据应用的需要,有向图的表示以多种方式使用。一个有向图如其中的节点是人,边捕获的友谊关系也称为数据图。一个有向图,其中节点是对象的类(如Book、Book等),边捕获子类关系,也称为分类学。在一些数据模型中,A 被称为主语,B 被称为谓语,C被称为对象。
Many interesting computations over graphs can be reduced to navigation. For example, in a friendship knowledge graph, to calculate the friends of a friends of a person A, we can navigate the knowledge graph from A to all nodes B connected to it by a relation labeled as friend, and then recursively to all nodes C connected by the friend relation to each B.
图上许多有趣的计算可以归结为导航。例如,在友谊知识图中,为了计算一个人A的朋友的朋友,我们可以将知识图从A导航到由朋友标记的关系连接到它的所有节点B,然后递归到由每个B的朋友关系连接到的所有节点C。
A path in a graph G is a series of nodes (v1, v2,..., vn) where for any i ∈ N with 1 ≤ i < n, there is an edge from vi to vi+1. A simple path is a path with no repeated nodes. A cycle is a path in which the first and the last nodes are the same. Usually, we are interested in only those paths in which the edge label is the same for every pair of nodes. It is possible to define numerous additional properties over the graphs (e.g., connected components, strongly connected components), and provide different ways to traverse the graphs (e.g., shortest path, Hamiltonian path, etc.).
图G中的路径是一系列节点( v1,v2,…,vn ),其中对于任意i∈N,1≤ i < n,有一条从vi到vi + 1的边。简单路径是一条没有重复节点的路径。一个循环是第一个和最后一个节点相同的路径。通常,我们只对每一对节点的边标签相同的路径感兴趣。它可以定义图的许多附加性质(如连通分量、强连通分量),并提供不同的遍历方法(如最短路径、Hamilton路径等) 。
3. Recent Applications of Knowledge Graphs
There are numerous applications of knowledge graphs both in research and industry. Within computer science, there are many uses of a directed graph representation, for example, data flow graphs, binary decision diagrams, state charts, etc. For our discussion here, we have chosen to focus on two concrete applications that have led to recent surge in popularity of knowledge graphs: organizing information over internet and data integration.
知识图谱在学术界和工业界中都有大量应用。 在计算机科学中,有向图表示法有许多用途,例如,数据流图,二进制决策图,状态图等。在这里的讨论中,我们选择专注于两个具体的应用程序,这些应用程序导致了最近知识图的流行:通过互联网组织信息和数据集成。
3.1 Knowledge Graphs for organizing Knowledge over the Internet
We will explain the use of a knowledge graph over the web by taking the concrete example of Wikidata. Wikidata acts as the central storage for the structured data for Wikipedia. To show the interplay between the two, and to motivate the use of Wikidata knowledge graph, consider the city of Winterthur in Switzerland which has a page in Wikipedia. The Wikipedia page for Winterthur lists its twin towns: two are in Switerzland, one in Czech Republic, and one in Austria. The city of Ontario in California that has a Wikipedia page titled Ontario, California, lists Winterthur as its sister city. The sister city and twin city relationships are identical as well as reciprocal. Thus, if a city A is a sister city of another city B, then B must be a sister city of A. This inference should be automatic, but because this information is stated in English in Wikipedia, it is not easy to detect this discrepancy. In contrast, in the Wikidata representation of Winterthur, there is a relationship called twinned administrative body that lists the city of Ontario. As this relationship is symmetric, the Wikidata page for the city of Ontario automatically includes Winterthur. Thus, when Wikidata knowledge graph will be fully integrated into Wikipedia, such discrepancies will naturally disappear.
我们将以Wikidata的具体示例来说明知识图谱在网络上的用法。 Wikidata充当Wikipedia的结构化数据的中央存储。为了显示两者之间的相互作用,并激发Wikidata知识图谱的使用,请考虑瑞士的温特图尔市,该市在Wikipedia中有一个页面。温特图尔(Winterthur)的维基百科页面列出了它的两个城镇:两个在瑞士,一个在捷克,一个在奥地利。加利福尼亚的安大略省城市有一个维基百科页面,标题为加利福尼亚的安大略省,将温特图尔列为其姊妹城市。姊妹城市和双胞胎城市的关系是相同的,也是相互的。因此,如果一个城市A是另一个城市B的姊妹城市,则B必须是A的姊妹城市。这种推断应该是自动的,但是由于此信息在Wikipedia中用英语陈述,因此检测这种差异并不容易。 相反,在温特图尔(Winterthur)的Wikidata表示中,有一个称为“孪生行政机构”的关系,其中列出了安大略省的城市。由于这种关系是对称的,因此安大略市的Wikidata页面自动包含Winterthur。因此,当Wikidata知识图谱完全整合到Wikipedia中时,这种差异自然就会消失。
Wikidata includes data from several independent providers, for example, the Library of Congress that publishes data containing information about Winterthur. By using the Wikidata identifier for Winterthur, the information released by Library of Congress can be easily linked with information available from other sources. Wikidata makes it easy to establish such links by publishing the definitions of relationships used in it in Schema.Org.
Wikidata包含来自几个独立提供商的数据,例如,国会图书馆发布包含有关Winterthur信息的数据。 通过使用Winterthur的Wikidata标识符,可以轻松地将国会图书馆发布的信息与其他来源的信息链接起来。Wikidata通过在Schema.Org中发布其中使用的关系的定义,使建立此类链接变得容易。
The vocabulary of relations in Schema.Org gives us, at least, three advantages. First, it is possible to write queries that span across multiple datasets that would not have been possible otherwise. One example of such a query is: Display on a map the birth cities of people who died in Winterthour? Second, with such a query capability, it is possible to easily generate structured information boxes within Wikipedia. Third, structured information returned by queries also can appear in the search results which is now a standard feature for the leading search engines.
Schema.Org 中的关系词汇至少为我们提供了三个优点。 首先,可以编写跨多个数据集的查询,否则这些查询是不可能的。 这种查询的一个示例是:在地图上显示在温特特尔(Winterthour)死亡的人的出生城市? 其次,借助这种查询功能,可以轻松地在Wikipedia中生成结构化的信息框。 第三,查询返回的结构化信息也可以出现在搜索结果中,这已成为领先搜索引擎的标准功能。
A recent version of Wikidata had over 80 million objects, with over one billion relationships among those objects. Wikidata makes connections across over 4872 different catalogs in 414 different languages published by independent data providers. As per the recent estimate, 31% of the websites, and over 12 million data providers publish Schema.Org annotations are currently using the vocabulary of Schema.Org.
Wikidata的最新版本有8000万个对象,这些对象之间的关系超过10亿个。 Wikidata通过独立数据提供者发布的414种不同语言,跨4872个不同目录建立了连接。 根据最近的估计,目前有31%的网站和超过1200万的数据提供者发布了Schema.Org注释,它们使用的是Schema.Org词汇。
Let us observe several key features of the Wikidata knowledge graph. First, it is a graph of unprecedented scale, and is the largest knowledge graph available today. Second, it is being jointly created by a community of contributors. Third, some of the data in Wikidata may come from automatically extracted information, but it must be easily understood and verified as per the Wikidata editorial policies. Fourth, there is an explicit effort to provide semantic definitions of different relation names through the vocabulary in Schema.Org. Finally, the primary driving use case for Wikidata is to improve the web search. Even though Wikidata has several applications using it for analytical and visualization tasks, but its use over the web continues to be the most compelling and easily understood application.
让我们观察一下Wikidata知识图谱的几个关键特征。 首先,它是前所未有的规模的图,并且是当今最大的知识图谱。 第二,它是由贡献者社区共同创建的。 第三,Wikidata中的某些数据可能来自自动提取的信息,但是必须根据Wikidata编辑政策轻松理解和验证。 第四,通过Schema.Org中的词汇表,人们做出了明显的努力来提供不同关系名称的语义定义。 最后,Wikidata的主要驱动用例是改进网络搜索。 尽管Wikidata有多个应用使用它来执行分析和可视化任务,但是它在Web上的使用仍然是最引人注目且易于理解的应用程序。
3.2 Knowledge Graphs for Data Integration in Enterprises
Data integration is the process of combining data from different sources, and providing the user with a unified view of data. A large fraction of data in the enterprises resides in the relational databases. One approach to data integration relies on a global schema that captures the interrelationships between the data items represented across these databases. Creating a global schema is an extremely difficult process because there are many tables and attributes; the experts who created these databases are usually not available; and because of lack of documentation, it is difficult to understand the meaning of the data. Because of the challenges in creating a global schema, it is convenient to sidestep this issue, and convert the relational data into a database with the generic schema of triples, ie, a knowledge graph. The mappings between the attributes are created on as needed basis, for example, in response to addressing specific business questions, and can themselves be represented within a knowledge graph. We illustrate this process using a concrete example.
数据集成是合并来自不同来源的数据并为用户提供数据统一视图的过程。企业中的大部分数据都驻留在关系数据库中。一种数据集成方法依赖于全局模式,该模式捕获跨这些数据库表示的数据项之间的相互关系。创建全局模式是一个非常困难的过程,因为有许多表和属性。创建这些数据库的专家通常联系不到;而且由于缺乏文档,因此很难理解数据的含义。由于创建全局模式遇到的挑战,避开此问题,并使用三元组的通用架构(知识图谱)将关系数据转换为数据库是很方便的。属性之间的映射是根据需要创建的,例如,响应于解决特定的业务问题,并且可以自己在知识图中表示。我们用一个具体的例子来说明这个过程。
Many financial institutions are interested in creating a company knowledge graph that combines the internal customer data with the data licensed from third parties. Some examples of such third party datasets include Dunn & Bradstreet, S&P 500, etc. An example usage of a company knowledge graph is to assess the risk while making loan decisions. The external data contain information such as the suppliers of a company. If a company is going through financial difficulty, it increases the risk of awarding loan to the suppliers of that company. To combine this external data with the internal data, one has to relate the external schemas with the internal company schema. Furthermore, the company names used in the external sources have to be related to the corresponding customer identifiers used by the financial institutions. While using a knowledge graph approach to data integration, determining such relationships can be delayed until they are actually required.
许多金融机构都对创建公司知识图谱感兴趣,该图将内部客户数据与第三方许可的数据结合在一起。 此类第三方数据集的一些示例包括Dunn&Bradstreet,S&P 500等。公司知识图谱的示例用法是在制定贷款决策时评估风险。 外部数据包含诸如公司供应商之类的信息。 如果公司遇到财务困难,则会增加向该公司的供应商提供贷款的风险。 为了将这种外部数据与内部数据结合起来,必须将外部模式与内部公司模式相关联。 此外,外部来源中使用的公司名称必须与金融机构使用的相应客户标识符相关。 在使用知识图谱方法进行数据集成时,可以延迟确定此类关系,直到实际需要它们为止。
4. Knowledge Graphs in Artificial Intelligence
Knowledge graphs, known as semantic networks, have been used as a representation for Artificial Intelligence since the early days of the field. Over the years, semantic networks were evolved into different representations such as conceptual graphs, description logics, and rule languages. To capture uncertain knowledge, probabilistic graphical models were invented.
从该领域的早期开始,称为语义网络的知识图就已被用作人工智能的表示。 多年来,语义网络已演变为不同的表示形式,例如概念图,描述逻辑和规则语言。 为了捕获不确定的知识,发明了概率图形模型。
A widely known application of the representation languages that originated from semantic networks is in capturing ontologies. An ontology is formal specification of the conceptualization of a domain. An ontology plays important role in information exchange and in capturing the background knowledge of a domain that could be used for reasoning and answering questions.
源自语义网络的表示语言的广泛应用是捕获本体。 本体是领域概念化的形式规范。 本体在信息交换和捕获可用于推理和回答问题的领域的背景知识中起着重要作用。
World Wide Web Consortium (W3C) standardized a family of knowledge representation languages that are now widely used for capturing knowledge on the internet. We will consider one such language known as the Resource Description Frame (RDF) in the next chapter. This family of languages also includes the Web Ontology Language (OWL), and the Semantic Web Rule Language (SWRL).
万维网联盟(W3C)标准化了一系列知识表示语言,这些语言现已广泛用于在Internet上捕获知识。 在下一章中,我们将考虑一种称为资源描述框架(RDF)的语言。 该语言家族还包括Web本体语言(OWL)和语义Web规则语言(SWRL)。
Orthogonal to the representation of knowledge, a central challenge in AI is knowledge acquisition bottleneck, ie, how to capture knowledge into the chosen representation in an economically scalable manner. Early approaches relied on knowledge engineering. Efforts to automate portions of knowledge engineering led to techniques such as inductive learning, and the current generation of machine learning.
与知识的表示正交,人工智能的一个主要挑战是知识获取的瓶颈,即如何以经济上可扩展的方式将知识捕获到所选的表示中。 早期方法依赖于知识工程。 使知识工程的各个部分自动化的努力导致了诸如归纳学习和当前的机器学习之类的技术。
Therefore, it is natural that the knowledge graphs are being used as a representation of choice for storing the knowledge automatically learned. There is also an increasing interest to leverage domain knowledge that is expressed in knowledge graphs to improve machine learning.
因此,自然而然地将知识图谱用作存储自动学习的知识的选择的表示。 利用知识图谱中表示的领域知识来改善机器学习的兴趣也越来越浓厚。
4.1 Knowledge Graphs as the output of Machine Learning
We will consider how graphs are being used as a target output representation for natural language processing and computer vision algorithms.
我们将考虑如何将图形用作自然语言处理和计算机视觉算法的目标输出表示。
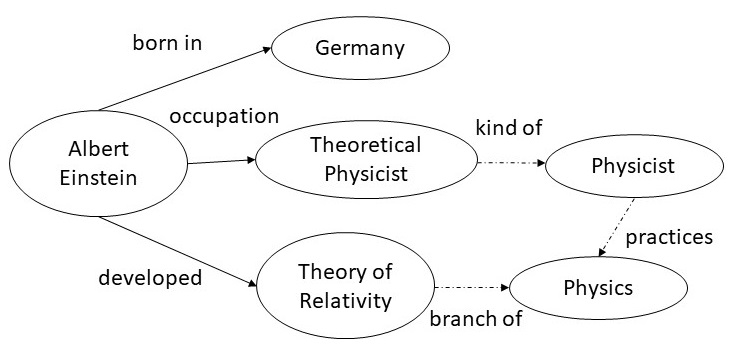
Entity extraction and relation extraction from text are two fundamental tasks in natural language processing. The extracted information from multiple portions of the text needs be correlated, and knowledge graphs provide a natural medium to accomplish such a goal. For example, from the sentence shown on the left, we can extract the entities Albert Einstein, Germany, Theoretical Physicist, and Theory of Relativity; and the relations born in, occupation and developed. Once this snippet of the knowledge graph is incorporated into a larger knowledge graph, we get additional links (shown by dotted edges) such as a Theoretical Physicist is a kind of Physicist who practices Physics, and that Theory of Relativity is a branch of Physics.
从文本进行实体提取和关系提取是自然语言处理中的两个基本任务。 从文本的多个部分中提取的信息需要进行关联,知识图提供了实现此目标的自然媒介。 例如,从左边显示的句子中,我们可以提取实体阿尔伯特·爱因斯坦,德国,理论物理学家和相对论; 和“出生于”,“职业”和“发达”的关系。 一旦将这一知识图谱片段合并到更大的知识图中,我们就会获得其他链接(用虚线显示),例如理论物理学家是实践物理学的物理学家,而相对论是物理学的分支。
Albert Einstein was a German-born theoretical physicist who developed the theory of relativity.
A holy grail of computer vision is the complete understanding of an image, that is, creating a model that can name and detect objects, describe their attributes, and recognize their relationships. Understanding scenes would enable important applications such as image search, question answering, and robotic interactions. Much progress has been made in recent years towards this goal, including image classification and object detection.
计算机视觉的一个圣杯是对图像的完全理解,即创建一个可以命名和检测对象,描述它们的属性以及识别它们之间关系的模型。 了解场景将启用重要的应用程序,例如图像搜索,问题解答和机器人交互。 近年来,朝着这个目标取得了许多进展,包括图像分类和物体检测。
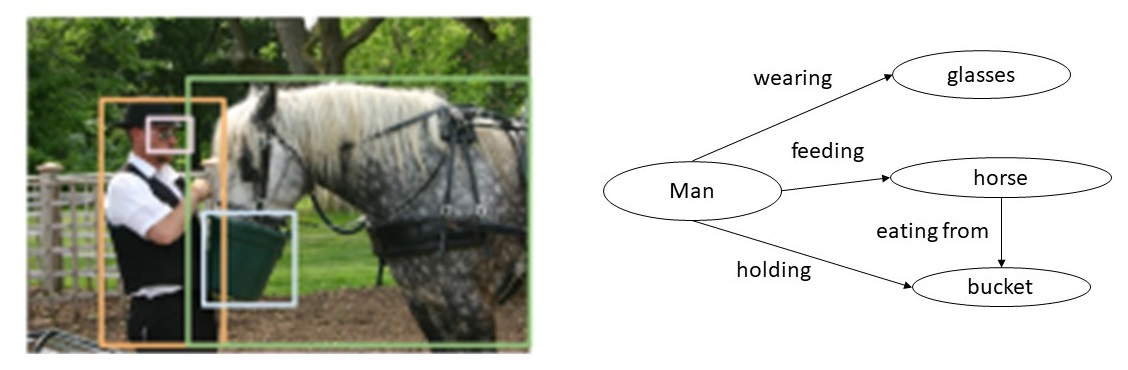
For example, from the image shown above, an image understanding system should produce a knowledge graph shown to the right. The nodes in the knowledge graph are the outputs of an object detector. Current research in computer vision focuses on developing techniques that can correctly infer the relationships between the objects, such as, man holding a bucket, and horse feeding from the bucket, etc. The knowledge graph shown to the right is an example of a knowledge graph.
例如,根据上面显示的图像,图像理解系统应生成右侧显示的知识图。 知识图中的节点是对象检测器的输出。 当前在计算机视觉方面的研究集中在开发能够正确推断对象之间关系的技术,例如人握住桶,以及马从桶中喂食等。右图所示的知识图就是一个例子。
4.2 Knowledge Graphs as input to Machine Learning
Popular deep machine learning models rely on a numerical input which requires that any symbolic or discrete structures should first be converted into a numerical representation. Embeddings that transform a symbolic input into a vector of numbers have emerged as a representation of choice for input to machine learning models. We will explain this concept and its relationship to knowledge graphs by taking the example of word embeddings and graph embeddings.
流行的深度机器学习模型依赖于数字输入,该数字输入要求任何符号或离散结构都应首先转换为数字表示形式。 将符号输入转换为数字向量的Embeddings 已经出现,代表了机器学习模型的输入选择。 我们将以“单词嵌入”和“图形嵌入”为例来说明此概念及其与知识图的关系。
Word embeddings were developed for calculating similarity between words. To understand the word embeddings, we consider the following set of sentences.
单词嵌入被开发用于计算单词之间的相似度。 为了理解单词嵌入,我们考虑以下句子。
| I like knowledge graphs. |
|---|
| I like databases. |
| I enjoy running. |
In the above set of sentences, we will count how often a word appears next to another word, and record the counts in a matrix shown below. For example, the word I appears next to the word like twice, and next to word enjoy once, and therefore, its counts for these two words are 2 and 1 respectively, and 0 for every other word. We can calculate the counts for other words in a similar manner to fill out the table.
在上面的句子集中,我们将计算一个单词在另一个单词旁边出现的频率,并将计数记录在下面所示的矩阵中。 例如,单词 I 两次出现在单词like 旁边,一次出现在单词enjoy 旁边,因此,这两个单词的计数分别为2和1,其他每个单词的计数为0。 我们可以类似的方式计算其他单词的计数,以填写表格。
| counts | I | like | enjoy | knowledge | graphs | databases | running | . |
|---|---|---|---|---|---|---|---|---|
| I | 0 | 2 | 1 | 0 | 0 | 0 | 0 | 0 |
| like | 2 | 0 | 0 | 1 | 0 | 1 | 0 | 0 |
| enjoy | 1 | 0 | 0 | 0 | 0 | 0 | 1 | 0 |
| knowledge | 0 | 1 | 0 | 0 | 1 | 0 | 0 | 0 |
| graphs | 0 | 0 | 0 | 1 | 0 | 0 | 0 | 1 |
| databases | 0 | 1 | 0 | 0 | 0 | 0 | 0 | 1 |
| running | 0 | 0 | 1 | 0 | 0 | 0 | 0 | 1 |
| . | 0 | 0 | 0 | 0 | 1 | 1 | 1 | 0 |
Above table constitutes a matrix which is often referred to as word cooccurrence counts. We say that the meaning of each word is captured by the vector in the row corresponding to that word. To calculate similarity between words, we can simply calculate the similarity between the vectors corresponding to them. In practice, we are interested in text that may contain millions of words, and a more compact representation is desired. As the above matrix is sparse, we can use techniques from Linear Algebra (e.g., singular value decomposition) to reduce its dimensions. The resulting vector corresponding to a word is known as word embedding. Typical word embeddings in use today rely on vectors of length 200. There are numerous variations and extensions of the basic idea presented here. Techniques exist for automatically learning word embeddings for any given text.
上表构成一个矩阵,通常称为“单词共现”计数。 我们说每个单词的含义被对应于该单词的行中的向量捕获。 为了计算单词之间的相似度,我们可以简单地计算与它们相对应的向量之间的相似度。 在实践中,我们对可能包含数百万个单词的文本感兴趣,因此需要更紧凑的表示形式。 由于上述矩阵稀疏,我们可以使用线性代数的技术(例如奇异值分解)来减小其尺寸。 对应于单词的结果向量称为单词嵌入。 当今使用的典型词嵌入依赖于长度为200的向量。此处介绍的基本概念有多种变体和扩展。 存在用于自动学习任何给定文本的词嵌入的技术。
Use of word embeddings has been found to improve the performance of many natural language processing tasks including entity extraction, relation extraction, parsing, passage retrieval, etc. One of the most common applications of word embeddings is in auto completion of search queries. Word embeddings give us a straightforward way to predict the words that are likely to follow the partial query that a user has already typed.
已经发现使用词嵌入可以改善许多自然语言处理任务的性能,包括实体提取,关系提取,解析,段落检索等。词嵌入的最常见应用之一是自动完成搜索查询。 词嵌入为我们提供了一种简单的方法来预测可能遵循用户已经输入的部分查询的词。
As a text is a sequence of words, and word embeddings calculate co-occurrences of words in it, we can view the text as a knowledge graph in which every word is a node, and there is a directed edge between each word and another word that immediately follows it. Graph embeddings generalize this notion for general network structure. The goal and approach, however, remains the same: represent each node in a knowledge graph by a vector, so that the similarity between the nodes can be calculated as a difference between their corresponding vectors. The vectors for each node are also referred to as graph embeddings.
由于文本是一个单词序列,并且单词嵌入会计算其中的单词共现,因此我们可以将文本视为一个知识图谱,其中每个单词都是一个节点,并且每个单词与另一个单词之间存在有向边紧随其后。 图嵌入概括了一般网络结构的这一概念。 但是,目标和方法保持不变:用向量表示知识图中的每个节点,以便可以将节点之间的相似度计算为它们相应向量之间的差。 每个节点的向量也称为图嵌入。
To calculate knowledge graph embeddings, we define a method for encoding each node in the graph into a vector, a function to calculate similarity between the nodes, and then optimize the encoding function. Encoding of a node into a vector is also known as a node embedding. One possible encoding function is to use random walks of the knowledge graph (typically 32 to 64 such random walks) and calculate co-occurrence counts of nodes on the knowledge graph yielding a matrix similar to co-occurrence counts of words in text. There are numerous variations of this basic method to calculate knowledge graph embeddings. Just like we have encoded a node into a vector, we can also encode the whole graph into a vector which is known as graph embedding. There are many approaches to calcuate graph embeddings, but perhaps, the simplest approach is to add the vectors for each of nodes in the graph and obtain a vector representing the whole graph.
为了计算知识图谱嵌入,我们定义了一种方法,用于将图中的每个节点编码为向量,该函数用于计算节点之间的相似度,然后优化编码功能。 将节点编码为向量也称为“节点嵌入”。 一种可能的编码功能是使用知识图的“随机游走”(通常为32至64个此类随机游走)并计算知识图谱中节点的共现计数,从而产生类似于文本中单词的共现计数的矩阵。 计算知识图谱嵌入的基本方法有多种变体。 就像我们将一个节点编码成一个向量一样,我们也可以将整个图编码成一个向量,这就是所谓的图嵌入。 计算图嵌入的方法有很多,但是也许最简单的方法是为图中的每个节点添加向量,并获得代表整个图的向量。
We have chosen to explain graph embeddings by first explaining word embeddings because as it is easy to understand them, and their use is common place. Graph embeddings are a generalization of the word embeddings. They are a way to input domain knowledge expressed in a knowledge graph into a machine learning algorithm. Graph embeddings do not induce a knowledge representation, but are a way to turn symbolic representation into a numeric representation for consumption by a machine learning algorithm.
我们选择首先解释单词嵌入来解释图形嵌入是因为它易于理解,并且它们的用法很普遍。 图嵌入是单词嵌入的概括。 它们是将知识图中表示的领域知识输入到机器学习算法中的一种方法。 图形嵌入不会产生知识表示,而是一种将符号表示转换为数值表示以供机器学习算法使用的方法。
Once we have calculated knowledge graph embeddings, they can be used for a variety of applications. One obvious use for the knowledge graph embeddings calculated from a friendship graph is to recommend new friends. A more advanced task involves link prediction (ie, the likelihood of a link between two nodes). Link prediction in a company graph could be used to identify potential new customers.
一旦我们计算出知识图嵌入,就可以将它们用于多种应用。 从友谊图计算出的知识图嵌入的一个明显用途是推荐新朋友。 更高级的任务涉及链接预测(即,两个节点之间链接的可能性)。 公司图中的链接预测可用于识别潜在的新客户。
5. Summary
Graphs are a fundamental construct in discrete mathematics, and have applications in all areas of computer science. Most notable uses of graphs in knowledge representation and databases have taken the form of data graphs, taxonomies and ontologies. Traditionally, such applications have been driven by a top down design. As a knowledge graph is a directed labeled graphs, we are able to leverage theory, algorithms and implementations from more general graph-based systems in computer science.
图是离散数学的基本结构,在计算机科学的所有领域中都有应用。 图在知识表示和数据库中最显着的用途是以数据图,分类法和本体论的形式。 传统上,此类应用是由自上而下的设计驱动的。 由于知识图是带标签的有向图,因此我们能够利用计算机科学中基于常规图的系统中的理论,算法和实现。
Recent surge in the use of knowledge graphs is driven because of the confluence of three different advances: data linking and sharing over the web graph computations over data, and progress in in NLP and vision to extract relations from texts and images. A common thread across all three of these advances is scale. The knowledge graphs that are available today are of unprecedented scale. We have already noted that a recent version of Wikidata had over 80 million objects, and over 1 Billion relationships. Several industry knowledge graphs are even bigger, for example, a recent version of the Google knowledge graph had over 570 million entities, and over 18 Billion relationships. This large scale of knowledge graphs makes the efficiency and scalability of the graph algorithms paramount.
由于三个不同的进步的融合,推动了知识图谱的最近使用激增:在数据上通过网络图计算进行数据链接和共享,以及在NLP和视觉中从文本和图像中提取关系的进步。 所有这三个方面的共同点是规模。 当今可用的知识图谱具有空前的规模。 我们已经注意到,最新版本的Wikidata具有超过8000万个对象,并且具有超过10亿个关系。 几个行业知识图甚至更大,例如,最新版本的Google知识图拥有超过5.7亿个实体,以及超过180亿个关系。 如此庞大的知识图谱使得图算法的效率和可扩展性至关重要。
For organizing information on the web, and in many data integration applications, it is extremely difficult to come up with a top down design of a schema. The machine learning applications are driven by the availability of the data, and what can be usefully inferred from it. Bottom up uses of knowledge graphs do not diminish the value of a top down design of the schema or an ontology. Indeed, the Wikidata project leverages ontologies for ensuring data quality, and most enterprise data integration projects advocate defining the schema on as needed basis. Machine learning applications also benefit significantly with the use of rich ontology for making inferences from the information that is learned even though a global ontology or a schema is not required at the outset.
为了在Web上以及在许多数据集成应用程序中组织信息,很难提出一种自上而下的模式设计。 机器学习应用程序受数据可用性的推动,并且可以从中得出有用的推论。 自底向上使用知识图并不会减少模式或本体的自顶向下设计的价值。 实际上,Wikidata项目利用本体来确保数据质量,并且大多数企业数据集成项目主张根据需要定义模式。 机器学习应用程序还可以通过使用丰富的本体从获取的信息中进行推断而受益匪浅,即使一开始就不需要全局本体或架构。
Word-embeddings and graph-embeddings both leverage a graph structure in the input data, but they are necessarily more general than knowledge graphs in that there is no implicit or explicit need for a schema or an ontology. For example, graph embeddings can be used over the network defined by exchange of messages between nodes on the internet, and then used in machine learning algorithms to predict rogue nodes. In contrast, for the Wikidata knowledge graph, knowledge graphs in the enterprises, and in the output representation of machine learning algorithms, a schema or ontology can play a central role.
词嵌入和图嵌入都利用输入数据中的图结构,但是它们不一定比“知识图”更通用,因为不需要隐式或显式的模式或本体需求。 例如,可以在通过Internet上的节点之间的消息交换定义的网络上使用图形嵌入,然后将其用于机器学习算法中以预测恶意节点。 相反,对于Wikidata知识图,企业中的知识图以及机器学习算法的输出表示,方案或本体可以发挥核心作用。
We conclude by observing that the recent surge in interest in knowledge graphs is primarily driven by the bottom up requirements of several compelling business applications. Knowledge graphs in these applications can certainly benefit from the classical work on the top down representation design techniques, and in fact, we envision that eventually the two will converge.
通过观察得出结论,最近对知识图谱的兴趣激增主要是由几个引人注目的业务应用程序的自下而上的要求所驱动。 这些应用程序中的知识图当然可以从自上而下的表示法设计技术的经典工作中受益,并且,事实上,我们设想最终两者将融合在一起。
Exercises
-
Exercise 1.1. Identify which of the following satisfies the definition of a knowledge graph introduced in this chapter.
(a)A data graph defined among data items representing real-world entities.
(b)A schema graph defined among classes in a schema.
(c)A process graph representing the steps of a process, their order, and branching conditions.
(d)A parse tree is an ordered, rooted tree that represents the syntactic structure of a string according to some context-free grammar.
(e)An entity relationship diagram shows the relationships of entity sets stored in a database.
A: yes yes no no no
-
Exercise 1.2. Which of the following counts as a well-defined meaning of the labels in a knowledge graph?
(a)Names of the labels in a human understandable language.
(b)Everything in (a) plus a documentation string that explains the label in sufficient detail.
(c)Embeddings calculated for the relation names over a large corpus of text.
(d)Everything in (a) plus a specification in a formal language.
(e)Everything in (b) plus a specification in a formal language.
A: no yes yes no yes
-
Exercise 1.3. Identify which of the following statements about knowledge graphs are true.
(a)Knowledge graphs are the only way to achieve data integration in enterprises.
(b)Edges in a knowledge graph are like the links between web documents except that the edges have semantically defined labels.
(c)A knowledge graph is the best representation for recording the output of NLP and vision algorithms.
(d)Semantic networks were the earliest knowledge graphs in AI.
(e)Understanding is to brain as a knowledge graph is to AI.
A: no yes no yes yes
-
Exercise 1.4. Identify if the following statements are true or true or false.
(a)If word embeddings of two words show high similarity, they are likely to be synonyms.
(b)A word embedding calculation views the text as a knowledge graph.
(c)A sentence is to a word embedding as a path is to a graph embedding.
(d)Edge detection is to computer vision as relation extraction is to NLP.
(e)Calculating similarity using word embeddings is always better than using hand curated sources.
A: no no yes yes no
-
Exercise 1.5. What is not new about the knowledge graphs in their recent usage?
(a)Directed labeled graph representation
(b)The large sizes of the knowledge graphs
(c)Creating a knowledge graph using automated methods
(d)Publicly available curated graph data sets
(e)Ability to make high value predictions using graph data
A: a