<%@ page language="java" contentType="text/html; charset=UTF-8" pageEncoding="UTF-8"%> <%@ taglib prefix="c" uri="http://java.sun.com/jsp/jstl/core" %> <%@taglib uri="http://java.sun.com/jsp/jstl/core" prefix="c"%> <!DOCTYPE html> <html> <head> <meta charset="utf-8"> <title>Document</title>
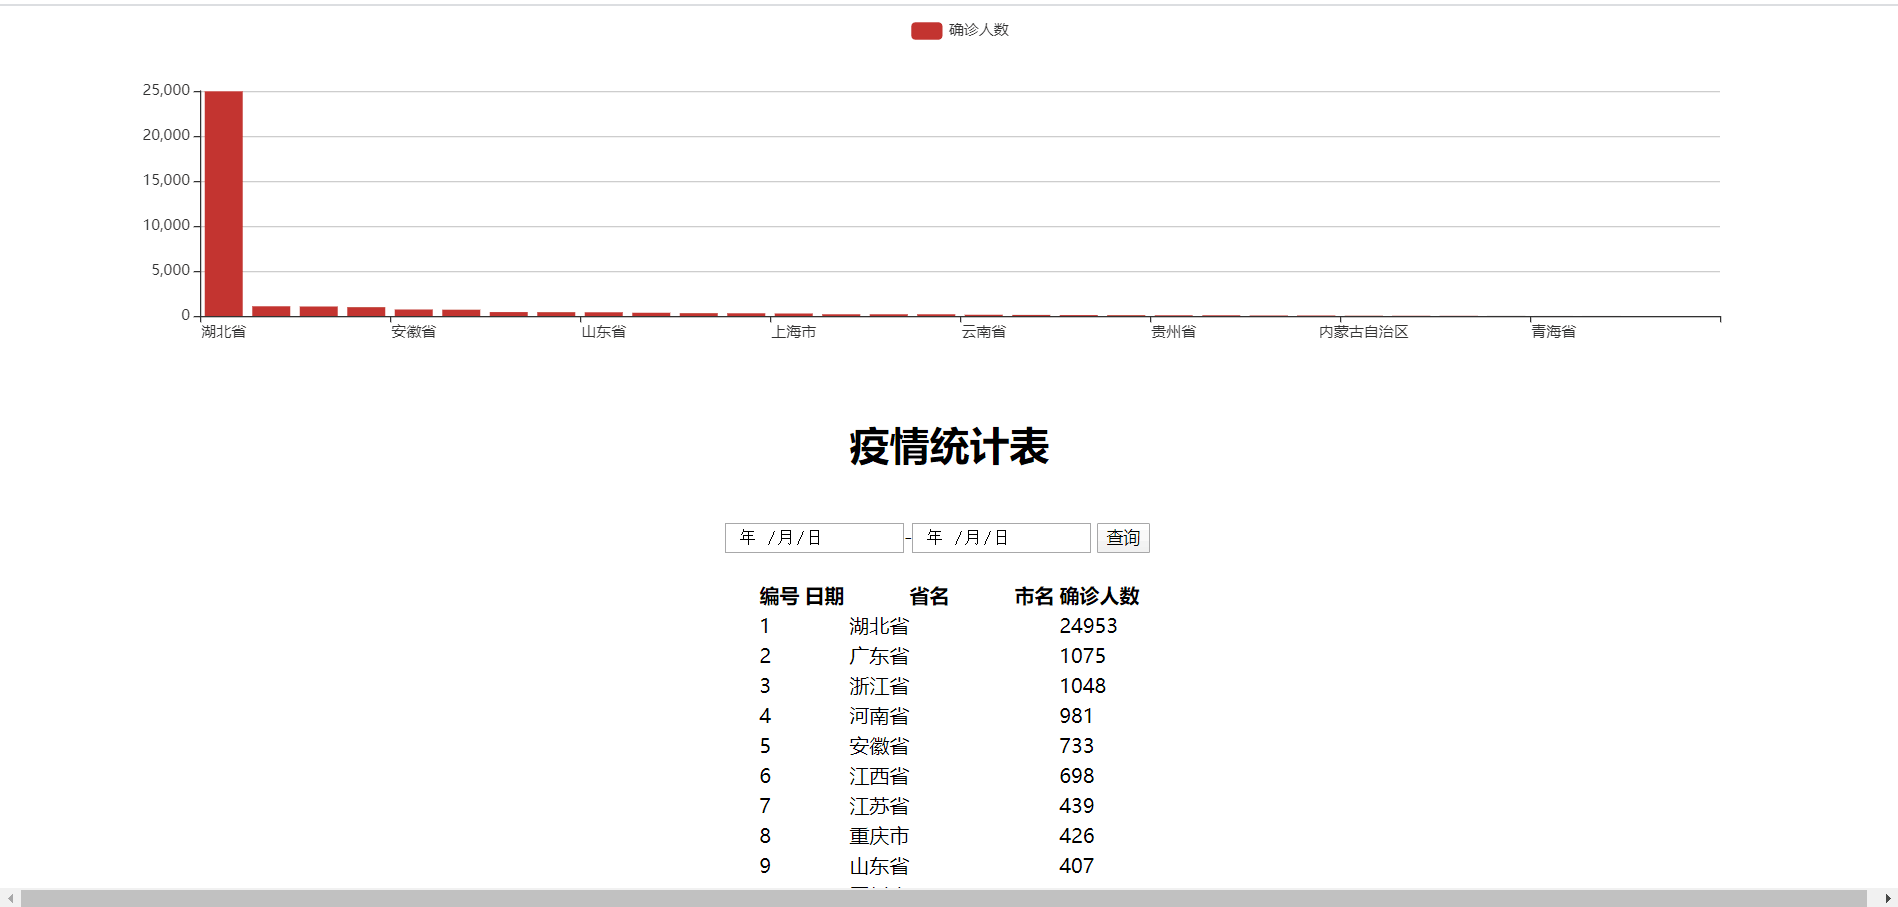
<script src="echarts.js"></script> </head> <body> <div id="chatr" style="height:300px"></div> <script type="text/javascript"> var myChart = echarts.init(document.getElementById('chart')); var arr = new Array(); var index = 0; <c:forEach items="${data}" var="item"> arr[index++] = ${item.confirmed}; </c:forEach> var option = { title: { text: '' }, tooltip: { show: true }, legend: { data:['确诊人数'] }, xAxis : [ { type : 'category', data : [ <c:forEach items="${data}" var="g"> ["${g.name}"], </c:forEach> ] } ], yAxis : [ { type : 'value' } ], series : [ { name:'确诊人数', type:'bar', data: arr } ] }; myChart.setOption(option); </script> <% Object message = request.getAttribute("message"); if (message != null && !"".equals(message)) { %> <script type="text/javascript"> alert("<%=request.getAttribute("message")%>"); </script> <% } %> <div align="center"> <h1>疫情统计表</h1> <br> <form action="/search" method="post"> <input type="date" id="btime" name="btime">-<input type="date" id="etime" name="etime"> <button type="button" class="btn btn-info">查询</button> <br><br> <table> <thead> <tr> <th>编号</th> <th>日期</th> <th>省名</th> <th>市名</th> <th>确诊人数</th> </tr> </thead> <tbody> <c:forEach items="${data}" var="item" varStatus="status"> <tr > <td>${status.count}</td> <td>${item.date}</td> <td>${item.name}</td> <td>${item.city}</td> <td>${item.confirmed}</td> </tr> </c:forEach> </tbody> </table> </div> </body> </html>
主要是需要掌握echarts的使用