4.4 Linear Correlation
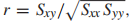
若由SxxSyySxy定义则为:

所以为了计算方便:

所以,可以明白的是,Sxx和Sx是不一样的!

所以,t r is independent of the choice of units and always lies between −1 and 1
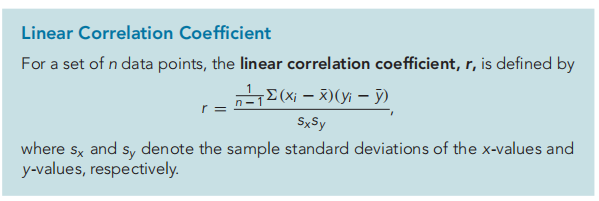
Understanding the Linear Correlation Coefficient
measures the strength of the linear relationship between two variables and that the following properties of r are meaningful only when the data points are scattered about a line.
r reflflects the slope of the scatterplot
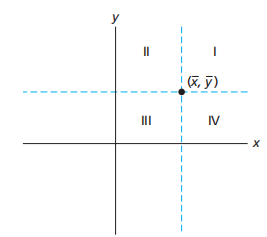
如图,若scatterplot为正向分布(平均看来,虽然有2,4可能存在值)即positively linearly correlated(正相关),,则point必在1,3区域;则Sxy必为正,则r值为正。若scatterplot为负向分布,则point必在2,4区域;则Sxy必为负,则r值为负,即negatively linearly correlated(负相关)。
原因:

则r与b1同号,所以
The magnitude of r indicates the strength of the linear relationship
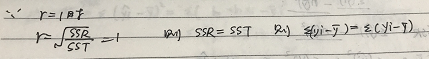
. A value of r close to −1 or to 1 indicates a strong linear relationship between the variables and that the variable x is a good linear predictor of the variable y
所以,绝对值大证明相关程度高,相关程度高则证明拟合直线的拟合成果好
以下是一些拟合直线和散点图的例子:
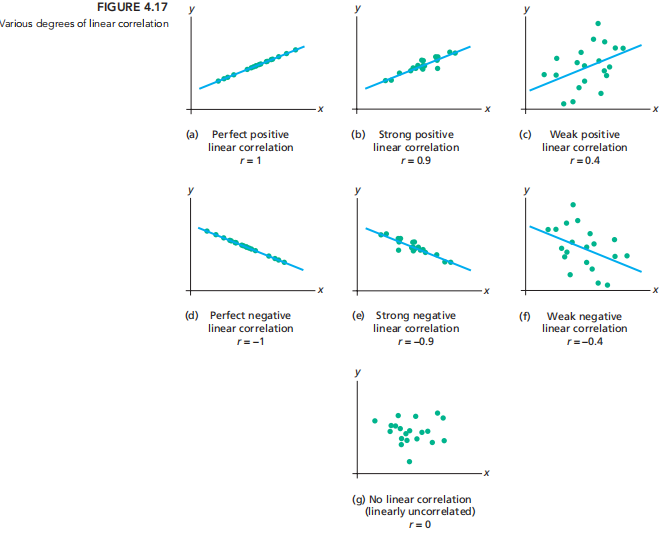
使用Linear Correlation Coefficient必须保证数据线性(即分布在一条直线上)
Noted:Correlation does not imply causation!
而对于密切相关的变量之间的关系的成因,可以理解为:Two variables may be strongly correlated because they are both associated with other variables, called lurking variables,For example, a study showed that teachers’ salaries and the dollar amount of liquor sales are positively linearly correlated. A possible explanation for this curious fact might be that both variables are tied to other variables, such as the rate of inflflation, that pull them along together.即有密切关联的两个变量,这两个变量若毫无联系,则可能是因为这两个变量之间的某些中间变量将其联系起来。