=============================静态数据=================================
<!doctype html>
<html lang="en">
  <head>
  <!--  <link rel="stylesheet" href="https://openlayers.org/en/v3.19.1/css/ol.css" type="text/css">-->
      <link href="v3.16.0/css/ol.css" rel="stylesheet" />
    <style>
      .map {
        height: 400px;
        width: 100%;
      }
    </style>
  <!--  <script src="https://openlayers.org/en/v3.19.1/build/ol.js" type="text/javascript"></script>-->
      <script src="v3.16.0/build/ol.js"></script>
      <script src="../js/jquery.min.js"></script>
    <title>OpenLayers 3 example</title>
  </head>
  <body>
    <h2>My Map</h2>
    <div id="map" class="map"></div>
    <script type="text/javascript">
        //$(function () {
        //    alert(1);
        //    var str = '{ "type": "Polygon", "coordinates": [[[122.07535436331365, 31.287773896004534], [122.07660470811187, 31.287773896004534], [122.07660470811187, 31.286523675043622], [122.07535436331365, 31.286523675043622], [122.07535436331365, 31.287773896004534]]] }';
        //    var arrycondinates = eval('(' + str + ')');
        //    console.log(arrycondinates.coordinates[0][0][0]);
        //    alert(arrycondinates.coordinates.toString().split(','));

        //});
        //var url = 'http://31.16.1.101/arcgis/rest/services/shsw_JCDXT/MapServer';
      var url = 'http://www.arcgisonline.cn/ArcGIS/rest/services/ChinaOnlineCommunity/MapServer';

        //初始化图层
      var  arcgisLayer = [new ol.layer.Tile(
            {
                source: new ol.source.TileArcGISRest({ url: url })
            })];


      var map = new ol.Map({
          target: 'map',//包含在地图的网页上的div元素
          layers: arcgisLayer,
            view: new ol.View({//负责地图的中心点,放大,投影之类的设置。
                // 设置上海为地图中心
                center: ol.proj.transform([121.4671519444444, 31.23494649118933], 'EPSG:4326', 'EPSG:3857'),
                zoom: 8,
                // 限制地图缩放最大级别为10,最小级别为6
                minZoom: 6,
                //maxZoom: 10
            })
      });
      var fStyle1 = new ol.style.Style({                                //图形样式
          fill: new ol.style.Fill({
              color: 'red'
          }),
          stroke: new ol.style.Stroke({
              color: 'red',
               2
          }),
          image: new ol.style.Circle({
              radius: 7,
              fill: new ol.style.Fill({
                  color: 'red'
              })
          })
      });
      //var vectorLayer = new ol.layer.Vector();
      ////定义矢量源
      //var vectorSource = new ol.source.Vector();
      //实例化一个矢量图层Vector作为绘制层
      //标线绘制层Vector
      var szDrawLayer = new ol.layer.Vector({
          source: new ol.source.Vector()
      });
      // 定义画图要用到的坐标点数组
      var point = [[121.61772816716022, 31.707848138871125], [121.61897851195846, 31.707848138871125], [121.61897851195846, 31.706597917910212], [121.61772816716022, 31.706597917910212], [121.61772816716022, 31.707848138871125]];

      var dots1 = new Array();
      for (var i = 0; i < point.length; i++) {
          point[i] = ol.proj.transform(point[i], 'EPSG:4326', 'EPSG:3857');
          dots1.push(point[i]);
      }
      var newFeature = new ol.Feature(new ol.geom.Polygon([dots1]));   //画图形
      newFeature.setStyle(fStyle1);                //给图形添加样式
      szDrawLayer.getSource().addFeature(newFeature);                 //地图添加图形
      map.addLayer(szDrawLayer);


      vectorLayer.getSource().addFeature(newFeature);                 //地图添加图形


      map.addLayer(vectorLayer);

    </script>
  </body>
</html>
==========================动态数据============================
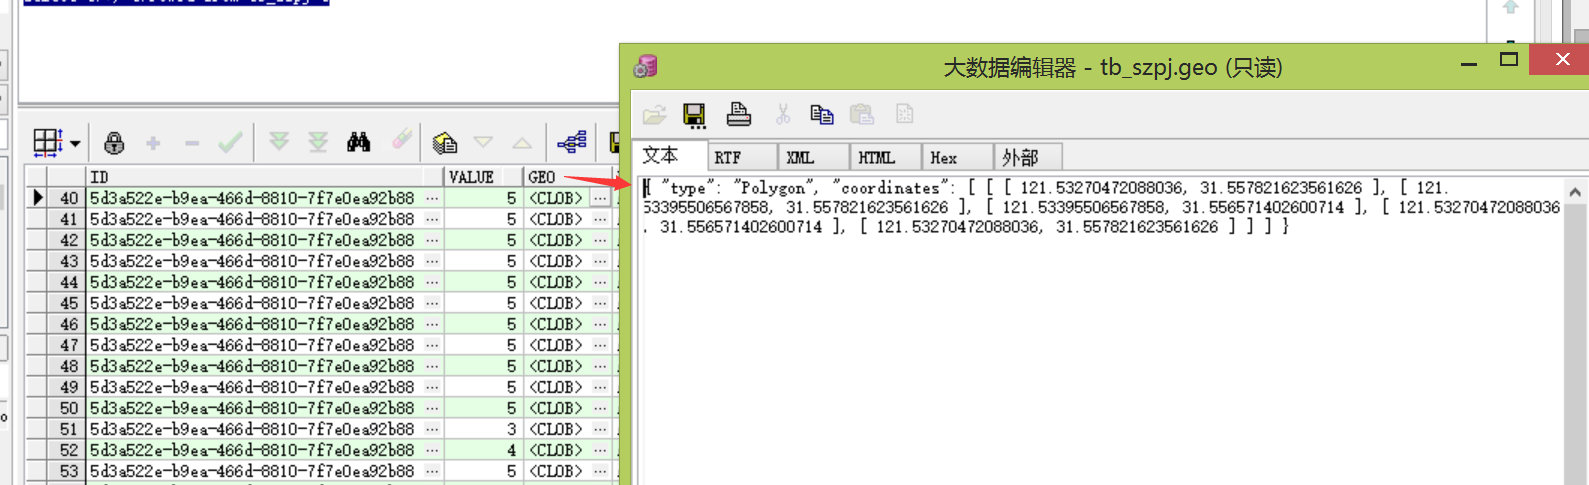
数据库表
主要就是value 字段和geo 字段,geo字段存的值是 type 图形类型和坐标点。
调用一般处理程序返回数据
[{"VALUE":5.0,"GEO":"{ "type": "Polygon", "coordinates": [ [ [ 121.61772816716022, 31.707848138871125 ], [ 121.61897851195846, 31.707848138871125 ], [ 121.61897851195846, 31.706597917910212 ], [ 121.61772816716022, 31.706597917910212 ], [ 121.61772816716022, 31.707848138871125 ] ] ] }"},{"VALUE":5.0,"GEO":"{ "type": "Polygon", "coordinates": [ [ [ 121.29013783002307, 31.699096592144734 ], [ 121.29138817482131, 31.699096592144734 ], [ 121.29138817482131, 31.697846371183822 ], [ 121.29013783002307, 31.697846371183822 ], [ 121.29013783002307, 31.699096592144734 ] ] ] }"}]
<!DOCTYPE html>
<html xmlns="http://www.w3.org/1999/xhtml">
<head>
    <meta http-equiv="Content-Type" content="text/html; charset=utf-8" />
    <title></title>
    <link href="Libs/jquery-ui-1.11.4/jquery-ui.min.css" rel="stylesheet" type="text/css" />
    <link href="Styles/style.css" rel="stylesheet" type="text/css" />
    <!-- jQuery库 -->
    <script src="YM/lib/jquery-1.7.2.js"></script>

    <!--OL3库-->

    <script src="Libs/ol/ol-debug.js" type="text/javascript"></script>
    <link href="Libs/ol/ol.css" rel="stylesheet" type="text/css" />

    <!-- 自定义js参数设置 -->
    <script src="js/pama.js"></script>
    <script src="js/baseMap.js"></script>
    <script>

        //实例化一个矢量图层Vector作为绘制层
        //标线绘制层Vector
        var szDrawLayer = new ol.layer.Vector({
            source: new ol.source.Vector()
        });

        //获取所有的水质坐标信息
        $(function () {
            //调用一般处理程序返回的数据,上面已经贴出返回的数据格式
            var urlStr = encodeURI(purl + "data_GetGeoSZ.ashx");


            $.ajax({
                type: "get",
                dataType: "json",
                url: urlStr,
                success: function (data) {

                    var resInfoArray = eval(data);

                    if (resInfoArray == null) {
                        alert("查询信息失败,请检查数据!");
                        return;
                    }
                    //显示风险源企业信息
                    for (var i = 0; i < resInfoArray.length; i++) {

                        var geoArray = eval('(' + resInfoArray[i].GEO + ')');// resInfoArray[i].GEO;

                       // alert(geoArray.coordinates);
                     //level 判断显示的图层样式,type 表示的是点线面,gearray.coordinates[0] 坐标点 如下makers
            // var makers = [[121.61772816716022, 31.707848138871125], [121.61897851195846, 31.707848138871125], [121.618      97851195846, 31.706597917910212], [121.61772816716022, 31.706597917910212], [121.61772816716022, 31.707848138871125]];
drawPolygon(resInfoArray[i].VALUE, geoArray.type,geoArray.coordinates[0]);
                    }
                    map.addLayer(szDrawLayer);

                }
            });

        });

        function drawPolygon(level, type, pointsStr) {
            var color = "#73b2ff";
            if (level == "2")
                color = "#b2ddf7";
            if (level == "3")
                color = "#beb1a1";
            if (level == "4")
                color = "#9b856e";
            if (level == "5")
                color = "#7a624a";

            var pointss = pointsStr;

            var dots1 = new Array();

            for (var i = 0; i < pointss.length; i++) {
                pointss[i] = ol.proj.transform(pointss[i], 'EPSG:4326', 'EPSG:3857');
                dots1.push(pointss[i]);
            }

            var newFeature = new ol.Feature(new ol.geom.Polygon([dots1]));   //画图形

            var fStyle1 = new ol.style.Style({                                //图形样式
                fill: new ol.style.Fill({
                    color: color
                }),
                stroke: new ol.style.Stroke({
                    color:color,
                     2
                }),
                image: new ol.style.Circle({
                    radius: 7,
                    fill: new ol.style.Fill({
                        color:color
                    })
                })
            });
            newFeature.setStyle(fStyle1);                                   //给图形添加样式
            szDrawLayer.getSource().addFeature(newFeature);                 //地图添加图形

        }
        function parsePointsb(color, type, pointsStr) {
                var polygonFeature = null;
                var lineFeature = null;
                var pointFeature = null;
                var allFeature = null;
                //绘制的几何图形要素
                switch (type) {
                    case "Polygon": //面
                        allFeature = new ol.Feature(
                        new ol.geom.Polygon(pointsStr));
                    case "line"://线
                        allFeature = new ol.Feature(
                        new ol.geom.LineString(pointsStr));
                    case "point"://点
                        allFeature = new ol.Feature(new ol.geom.Point(pointsStr));
                    default:

                }

                //实例化一个矢量图层Vector作为绘制层
                var source = new ol.source.Vector({
                    features: allFeature
                });
                var vector = new ol.layer.Vector({
                    source: source,
                    style: new ol.style.Style({
                        fill: new ol.style.Fill({
                            color: color
                        }),
                        stroke: new ol.style.Stroke({
                            color: '#ffcc33',
                             2
                        }),
                        image: new ol.style.Circle({
                            radius: 7,
                            fill: new ol.style.Fill({
                                color: '#ffcc33'
                            })
                        })
                    })
                });
                map.addLayer(vector); //将绘制层添加到地图容器中
            }

    </script>
</head>
<body style="margin: 0px">

    <!-- 功能模块面板 end -->
    <!-- 地图容器-->
    <div id="map">
        <!-- Popup -->
        <div id="popup" class="ol-popup">
            <div id="popup-closer" class="ol-popup-closer"></div>
            <div id="popup-content">
            </div>
        </div>
        <input type="hidden" id="h_son" />
    </div>

</body>
</html>
下面贴的是basemap.js
var url = 'http://www.arcgisonline.cn/ArcGIS/rest/services/ChinaOnlineCommunity/MapServer';
    //初始化图层
   var  arcgisLayer = [new ol.layer.Tile(
        {
            source: new ol.source.TileArcGISRest({ url: url })
        })];
    //初始化地图容器
 var   map = new ol.Map({
        layers: arcgisLayer,//[googleLayer],
        target: 'map', //地图容器div的ID
        view: new ol.View({
            // 设置上海为地图中心
            center: ol.proj.transform([121.4671519444444, 31.23494649118933], 'EPSG:4326', 'EPSG:3857'),
            zoom: 8,
            // 限制地图缩放最大级别为10,最小级别为6
            minZoom: 6,


        })
    });
上面是个人的项目上遇到的根据坐标点画图,新手,老鸟勿喷,比我还新的如果看不懂,可以给我留言。