<script type="text/javascript" src="https://code.highcharts.com.cn/highcharts/highcharts.js"></script>
<script type="text/javascript">
var chart = Highcharts.chart('container', {
title: {
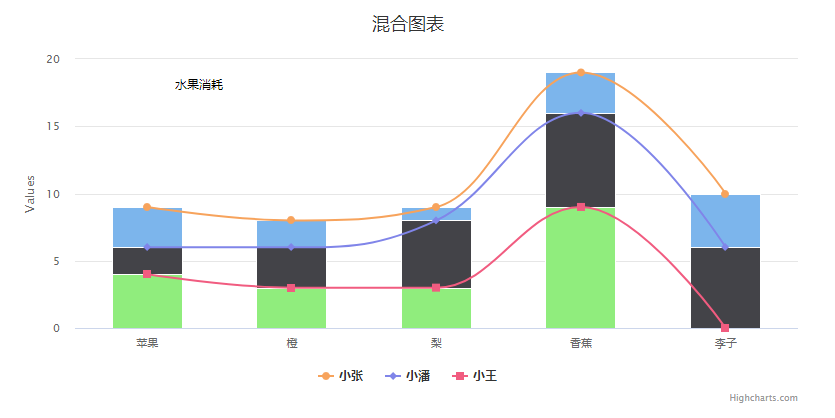
text: '混合图表'
},
xAxis: {
categories: ['苹果', ' 橙', '梨', '香蕉', '李子']
},
plotOptions: {
series: {
stacking: 'normal'
}
},
labels: {
items: [{
html: '水果消耗',
style: {
left: '100px',
top: '18px',
color: (Highcharts.theme && Highcharts.theme.textColor) || 'black'
}
}]
},
series: [{
type: 'column',
name: '小张',
data: [3, 2, 1, 3, 4],
showInLegend: false
}, {
type: 'column',
name: '小潘',
data: [2, 3, 5, 7, 6],
showInLegend: false
}, {
type: 'column',
name: '小王',
data: [4, 3, 3, 9, 0],
showInLegend: false
},{
type: 'spline',
name: '小张',
data: [3, 2, 1, 3, 4]
}, {
type: 'spline',
name: '小潘',
data: [2, 3, 5, 7, 6]
}, {
type: 'spline',
name: '小王',
data: [4, 3, 3, 9, 0]
} ]
});
</script>
<div id="container" style="max-800px;height:400px"></div>