需求:
kibana监控elasticsearch+kibana+logstash的性能寻找,性能瓶颈!
发现启动logstash加载logstash.yml,不读取配置好的xpack.monitoring.elasticsearch.url: "xxx"的值,而读取的系统默认的"http://localhost:9200"实例进行健康监测!,搞得懵逼了!,搞了好几天最后发现问题了,yaml语言的语法,开启的选项必须对齐。
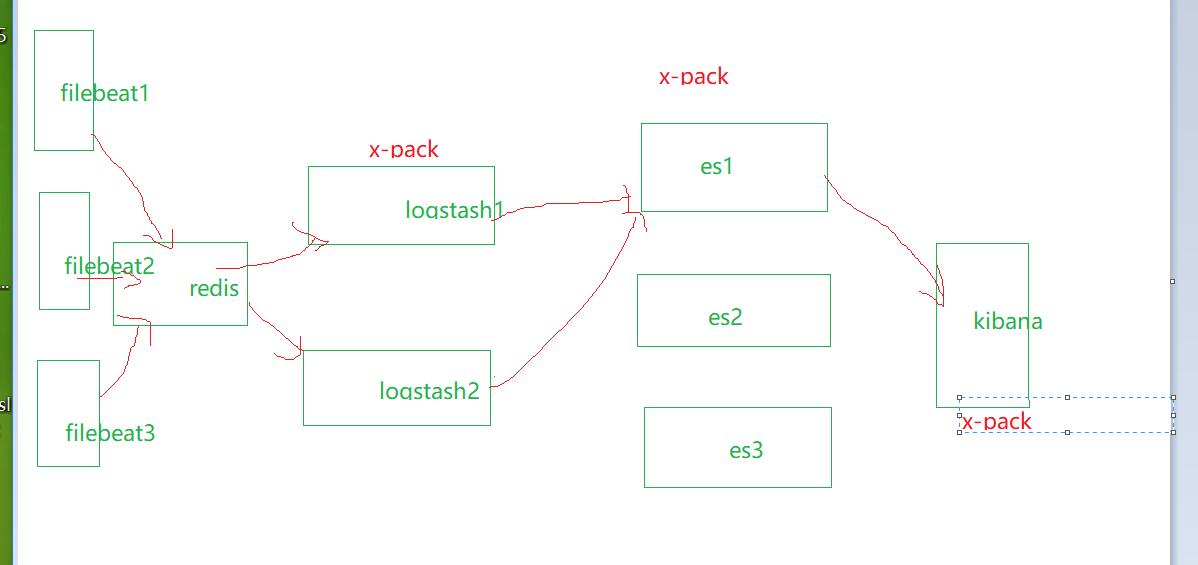
简单的elk架构
错误日志:
[ERROR][logstash.licensechecker.licensemanager] Unable to retrieve license information from license server {:message=>"Elasticsearch Unreachable: [http://localhost:9200/][Manticore::SocketException] Connection refused",
解决方案:
查看logstash.yml,对开启的参数需要对齐,方才读取参数的值!
[root@DZSWJ_NRGL config]# egrep -v "^#|^$" logstash.yml
node.name: node-lg-xxx.xxx
pipeline.workers: 3
pipeline.batch.size: 256
pipeline.batch.delay: 3000
http.host: "xxx.xxx.xxxx.xxx"
http.port: "9600"
log.level: warn
xpack.monitoring.elasticsearch.url: "http://xxx.xxx.xxx.xxx:9200"
xpack.monitoring.elasticsearch.username: "logstash_system"
xpack.monitoring.elasticsearch.password: "123123"
kibana展示图
