参照http://www.cnblogs.com/tippoint/p/3429092.html 进行安装xdebug:
首先自己写一个打印php的页面,将phpinfo 拷贝到下面的框内进行分析。

2. 未安装的情况下,会给出相应的提示:
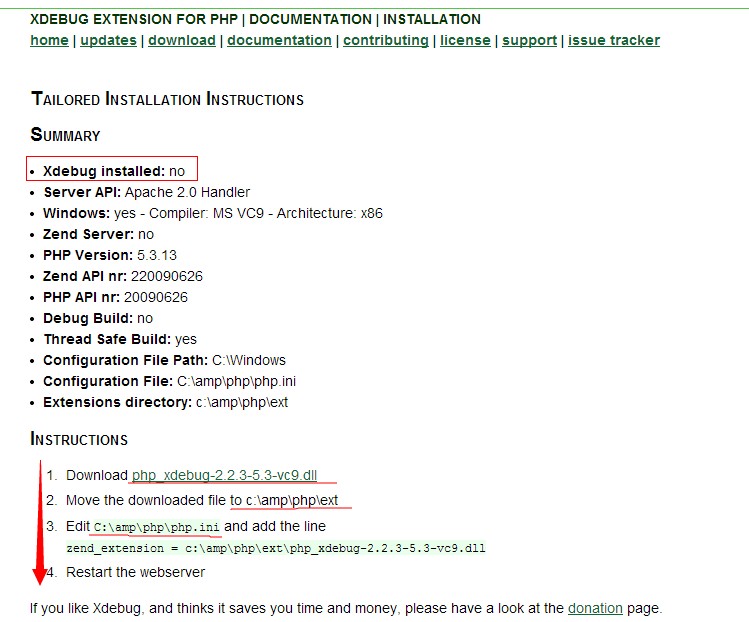
3.按照指示进行下载和配置。再次打印phpinfo,并测试:

4.安装成功以后配置phpStorm
1).首先需要修改php.ini内容如下:

[Xdebug]
zend_extension_ts ="c:/amp/php/ext/php_xdebug-2.1.2-5.2-vc6.dll"
xdebug.auto_trace=On
xdebug.collect_params=On
xdebug.collect_return=On
xdebug.trace_output_dir="c:/amp/php/debuginfo"
xdebug.profiler_enable=On
xdebug.profiler_output_dir="c:/amp/php/debuginfo"
xdebug.idekey=PhpStorm
xdebug.remote_enable=on
xdebug.remote_host=localhost
xdebug.remote_port=9000
xdebug.remote_handler=dbgp

2).phpstorm配置
- 客户端调试,打开phpStorm,进入File>Settings>PHP>Servers,这里要填写服务器端的相关信息,name填localhost,host填localhost,port填80,debugger选XDebug
- 进入File>Settings>PHP>Debug,看到XDebug选项卡,port填9000,其他默认
- 进入File>Settings>PHP>Debug>DBGp Proxy,IDE key 填 phpStorm,host 填localhost,port 填80
- 点OK退出设置。
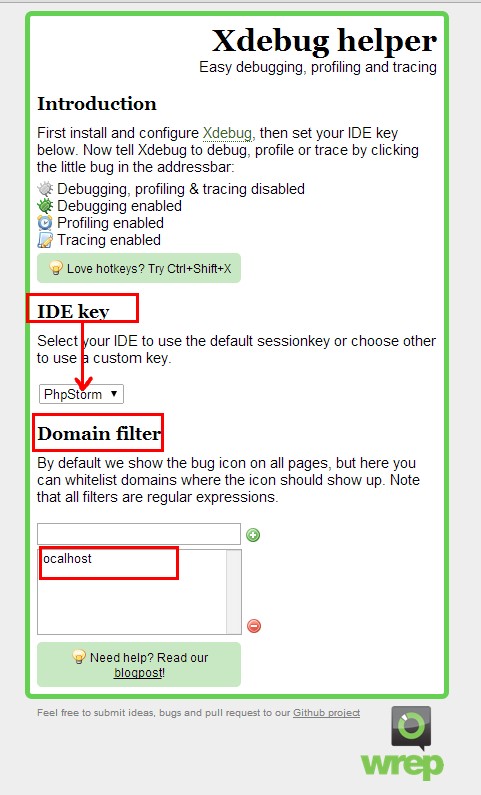
3).设置浏览器插件,xdebug helper
- 在chrome extentions里选择xdebug helper,设置白名单为localhost
-
然后在phpstorm中进行断点测试。