平面内,围绕某一中心点平均分布整数个正弦花瓣的曲线.
数学描述
在极坐标下可表示为ρ=a*sin(nθ),a为定长,n为整数.
图形描述
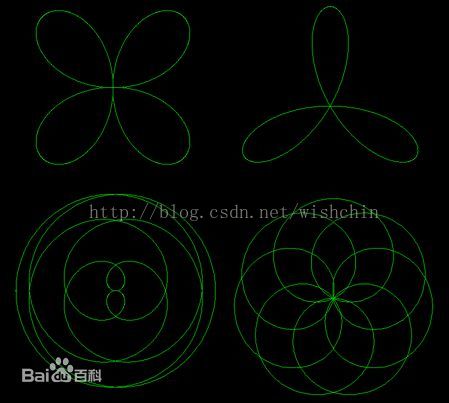
在极坐标系中,以下方程表示的曲线称为玫瑰曲线:
r = sin ( k θ ) 或 r = cos ( k θ )
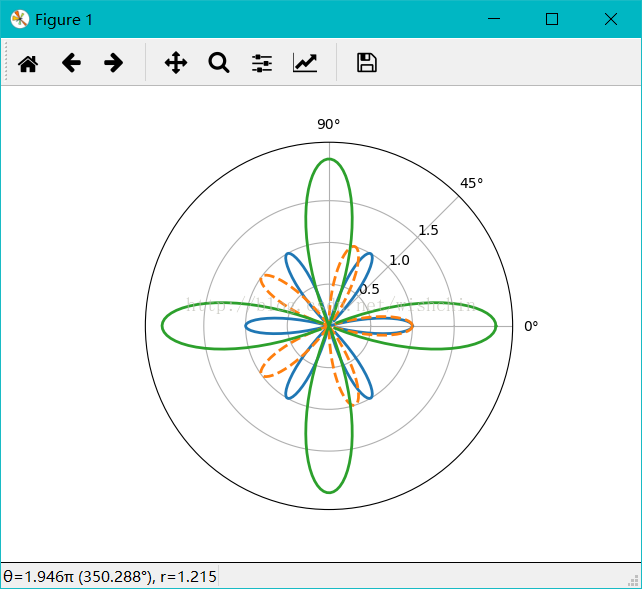
当 k 是奇数时,玫瑰曲线有 k 个花瓣;当 k 是偶数时,玫瑰曲线有 2k 个花瓣。执行效果如下图:
Python代码:
def drawFlowers():
    theta=np.arange(0,2*np.pi,0.02);
    plt.subplot(111,polar=True);

    plt.plot(theta,np.cos(6*theta),'-',lw=2);#6瓣花瓣
    plt.plot(theta,np.cos(5*theta),'--',lw=2);#5瓣花瓣
    plt.plot(theta,2*np.cos(4*theta),lw=2);#4瓣花瓣

    plt.rgrids(np.arange(0.5,2,0.5),angle=45);
    plt.thetagrids([0,45,90]);

    plt.show();
玫瑰曲线: