TA-Lib提供了常用的基础统计学函数,基于时间序列移动窗口进行计算。注意TA-Lib的beta,示例中是求某只股票的最高价与最低价序列的移动beta值,默认时间周期为5日,而资本资产定价中一般是分析某只股票相对于市场(大盘指数)的波动情况。
BETA : Beta Coefficient Capita Asset Pricing Model(CAPM) 资本资产定价模型里的beta系数:
ta.BETA(high, low, timeperiod=5),求两个序列的移动beta值(回归分析)
CORREL : Pearson's Correlation Coefficient(r) 皮尔逊相关系数:
ta.CORREL(high, low, timeperiod=30)
LINEARREG : Linear Regression 线性回归:
ta.LINEARREG(close, timeperiod=14),收盘价序列对时间t的线性回归,并输出预测值
LINEARREG_ANGLE : Linear Regression Angle 线性回归斜率的正切角度:
ta.LINEEARREG_ANGLE(close, timeperiod=14)收盘价序列对时间t的线性回归,并输出预测值
LINEARREG_INTERCEPT : Linear Regression Angle 线性回归截距:
ta.LINEARREG_INTERCEPR(close, timeperiod=14)
LINEARREG_SLOPE : Linear Regression Slope 线性回归斜率:
ta.LINEARREG_SLOPE(close, timeperiod=14)
STDDEV : Standard Deviation 标准差:
ta.STDDEV(close, timeperiod=5, nbdev=1),默认每5个收盘价计算标准差
TSF : Time Series Forecast 时间序列预测:
ta.TSF(close, timeperiod=14)
VAR : Variance 方差:
ta.VAR(close, timeperiod=5, nbdev=1)
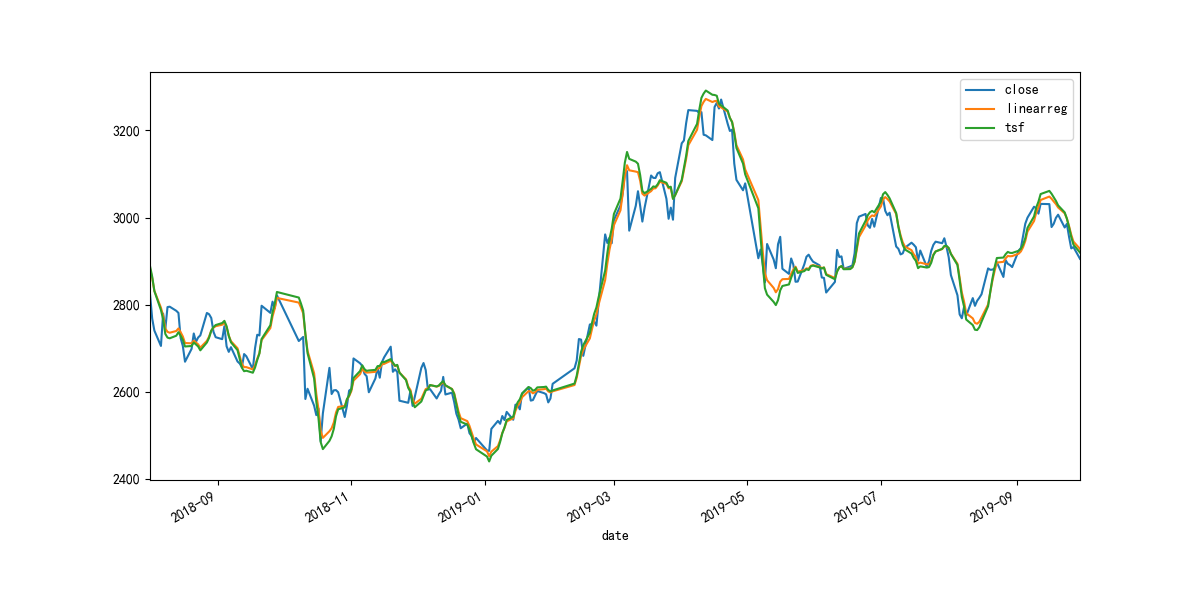
import pandas as pd
import numpy as np
import matplotlib.pyplot as plt
import talib as ta
import tushare as ts


plt.rcParams['font.sans-serif'] = ['SimHei']
plt.rcParams['axes.unicode_minus'] = False

def get_data(code, start='2015-01-01'):
    df = ts.get_k_data(code, start)
    df.index = pd.to_datetime(df.date)
    df = df.sort_index()
    return df

df = get_data('sh')[['open','close','high','low']]
df['linearreg'] = ta.LINEARREG(df.close, timeperiod=14)
df['tsf'] = ta.TSF(df.close, timeperiod=14)
df.loc['2018-08-01':, ['close','linearreg','tsf']
      ].plot(figsize=(12,6))
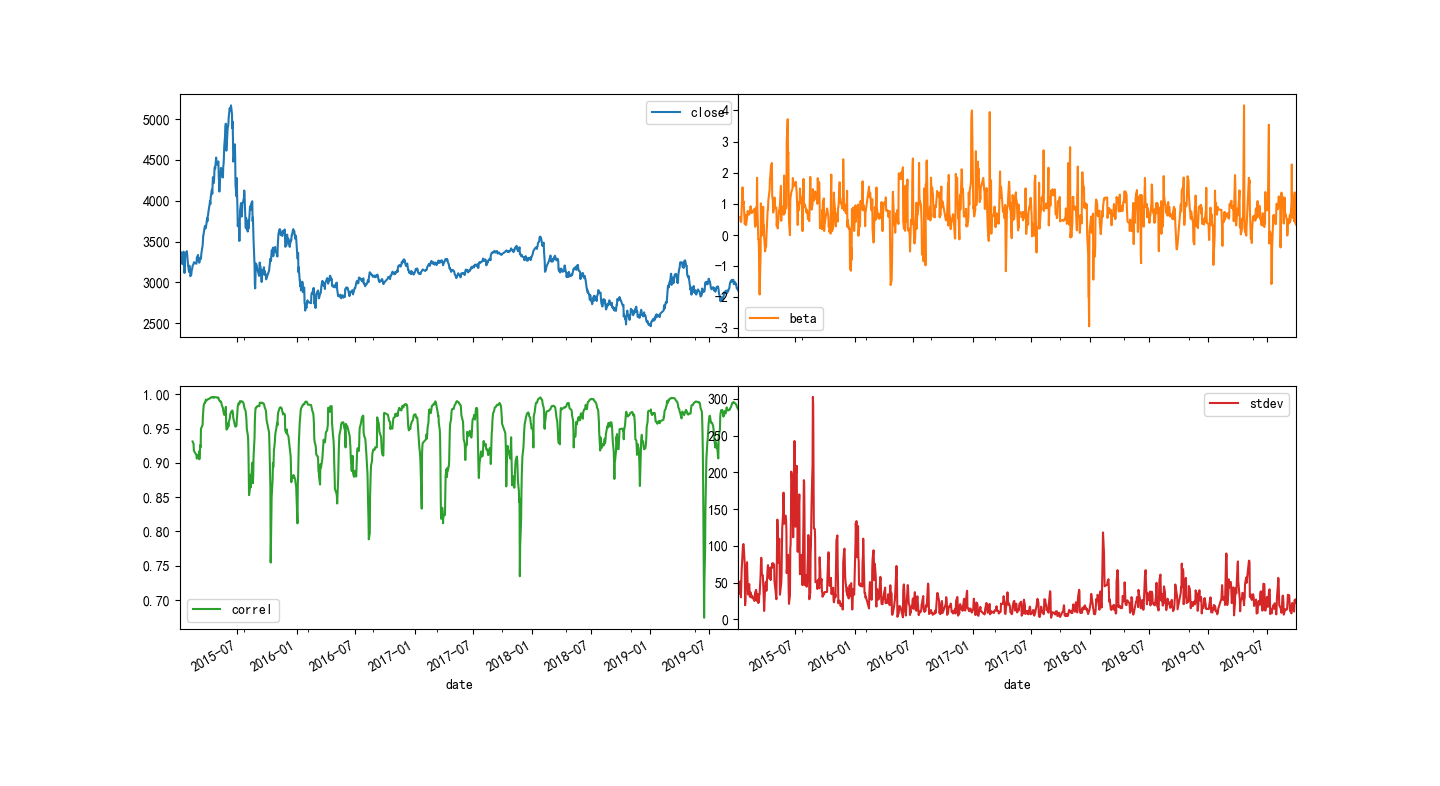
df['beta'] = ta.BETA(df.high, df.low, timeperiod=5)
df['correl'] = ta.CORREL(df.high, df.low, timeperiod=30)
df['stdev'] = ta.STDDEV(df.close, timeperiod=5, nbdev=1)

df[['close', 'beta', 'correl','stdev']
  ].plot(figsize=(18,8), subplots=True, layout=(2,2))
plt.subplots_adjust(wspace=0, hspace=0.2)