1. 为什么线性回归不可用?
通常,两个以上定性响应变量不能用线性回归建立模型
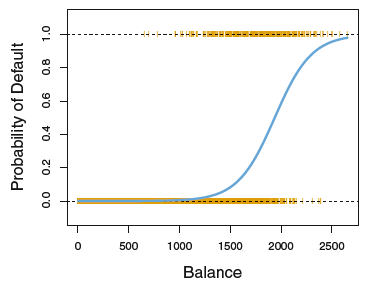
线性模型不能保证预测值在0,1之间
2. logistic regressiom
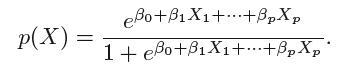
2.1 logistic model
logistic function:

odds:
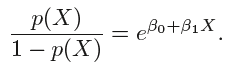
取值范围为0 到∞。其值接近于0 表示违约概率非常低,接近于∞则表示违约概率非常高。
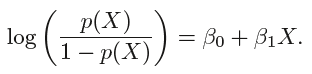
log-odds or logit:
2.2 Estimating the Regression Coefficients
the more general method of maximum likelihood is preferred
likelihood function:
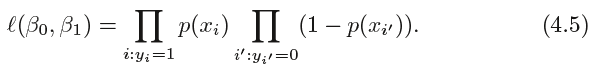
The estimates ˆ β0 and ˆβ1 are chosen to maximize this likelihood function
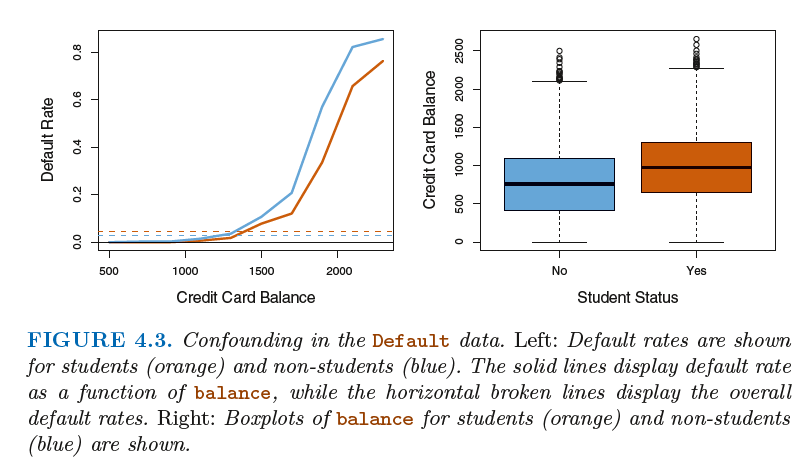
2.3 Multiple Logistic Regression

coruounding:
3. Linear Discriminant Analysis
LDA 分类器的结果是建立在每一类中观测值都来自于一个均值不同、方差相同(均为σ)的正态分布上
Why do we need another method, when we have logistic regression?
There are several reasons:
- When the classes are well-separated, the parameter estimates for the logistic regression model are surprisingly unstable. Linear discriminant analysis does not suffer from this problem.
- If n is small and the distribution of the predictors X is approximately normal in each of the classes, the linear discriminant model is again more stable than the logistic regression model.
- Linear discriminant analysis is popular when we have more than two response classes.
3.1 Using Bayes’ Theorem for Classification
贝叶斯定理:
当只有一个预测变量时: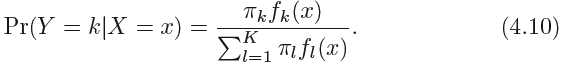
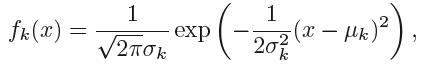
Suppose we assume that fk(x) is normal or Gaussian,normal density:

贝叶斯决策边界: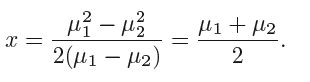
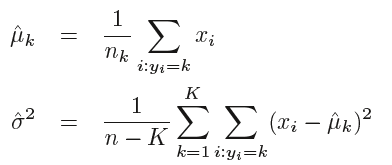
LDA通常使用以下参数估计:
对于多元的情况, we will assume that X = (X1,X2, . . .,Xp) is drawn from a multivariate Gaussian (or multivariate normal) distribution,
密度函数为: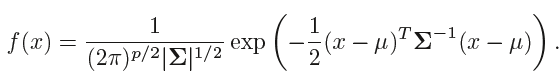
代入4.10可得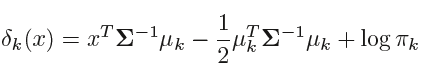
ROC曲线:
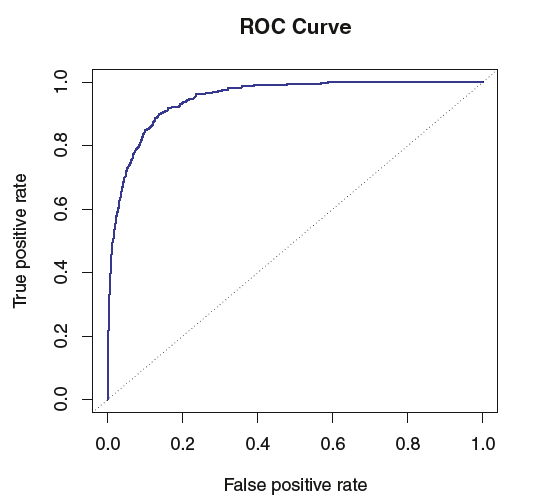
ROC 曲线的面积用(area under the ROCcrnve , AUC) 来表示的,该曲线能够涵盖所有可能的阀值。一个理想的ROC 曲线会紧贴左上
角,所以AUC 越大,分类器越好。
灵敏度:被正确判别违约者的比例;
特异度:被正确判别没有违约者的比例。
3.2 Quadratic Discriminant Analysis
QDA分类器也是假设每一类观测都服从一个高斯分布,和LDA不同的是第一类的协方差矩阵可以不同.
假设要观测的第k类分布形如 X~N(μk,∑k),其中∑k为其协方差矩阵,此时分类器把X = x分入使

最大的一组。是关于x的二次函数。
一般而言,如果训练观测数据囊相对较少, LDA 是一个比QDA 更好的决策,降低模型的方差很有必要。相反地,如果训练集非常大,则倾向于使用QDA
3.3分类方法的比较
These six examples illustrate that no one method will dominate the others in every situation. When the true decision boundaries are linear, then the LDA and logistic regression approaches will tend to perform well.When the boundaries are moderately non-linear, QDA may give better results. Finally, for much more complicated decision boundaries, a non-parametric approach such as KNN can be superior. But the level of smoothness for a non-parametric approach must be chosen carefully. In the next chapter we examine a number of approaches for choosing the correct level of smoothness
and, in general, for selecting the best overall method.