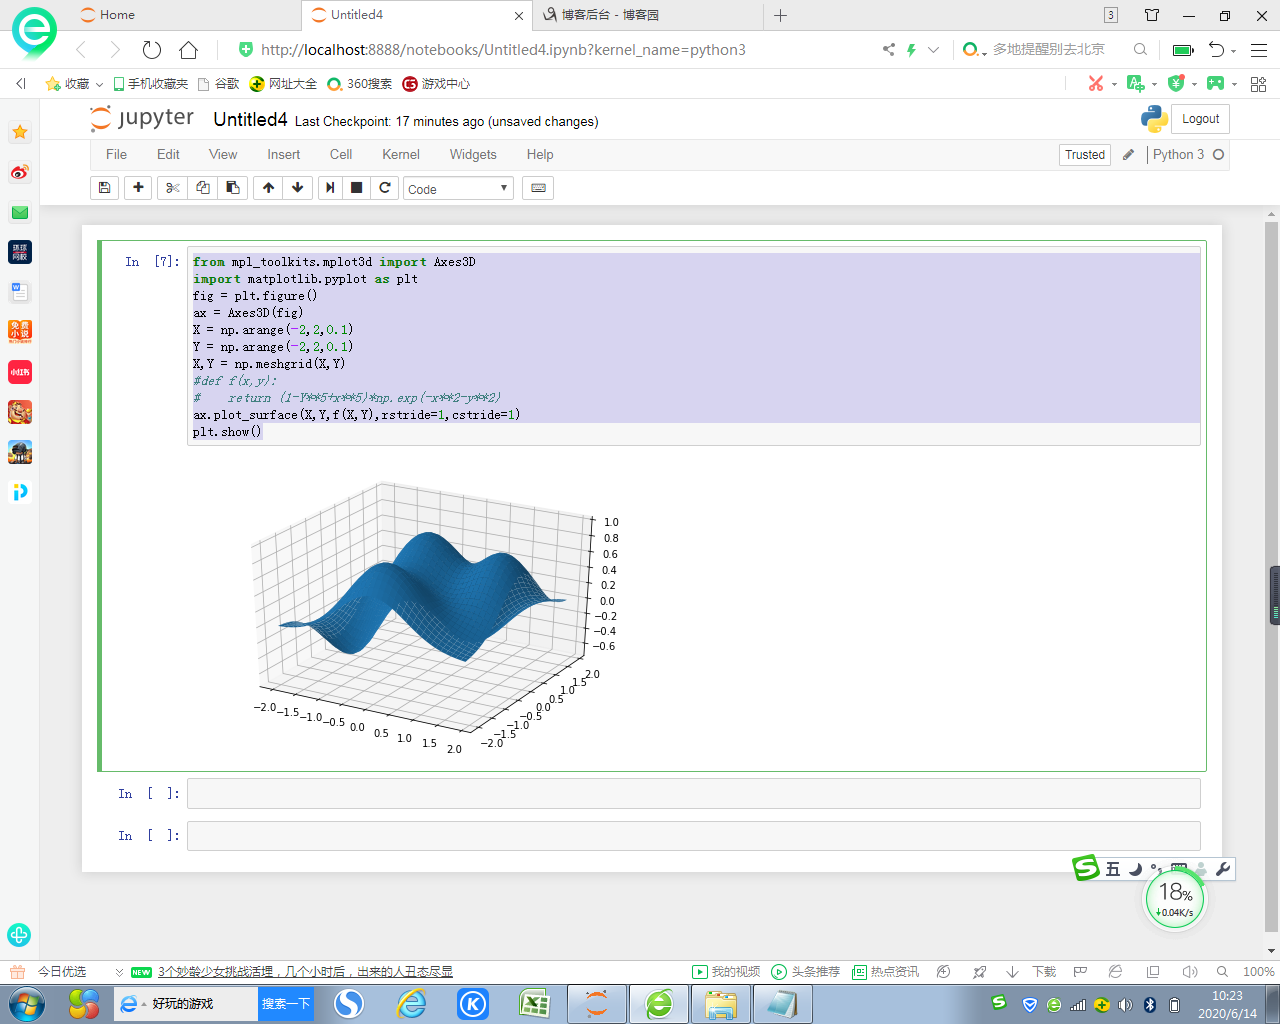
from mpl_toolkits.mplot3d import Axes3D
import matplotlib.pyplot as plt
fig = plt.figure()
ax = Axes3D(fig)
X = np.arange(-2,2,0.1)
Y = np.arange(-2,2,0.1)
X,Y = np.meshgrid(X,Y)
#def f(x,y):
# return (1-Y**5+x**5)*np.exp(-x**2-y**2)
ax.plot_surface(X,Y,f(X,Y),rstride=1,cstride=1)
plt.show()