一 Plotly 简介

Plotly是另一个免费进行数据分析和绘制图表的APP,建立在d3.js上。 Plotly图可下载为SVG,EPS或PNG格式,并简单地导入到Illustrator或者Photoshop中。详细内容可以去官网参考:
https://plot.ly/python/
1 安装
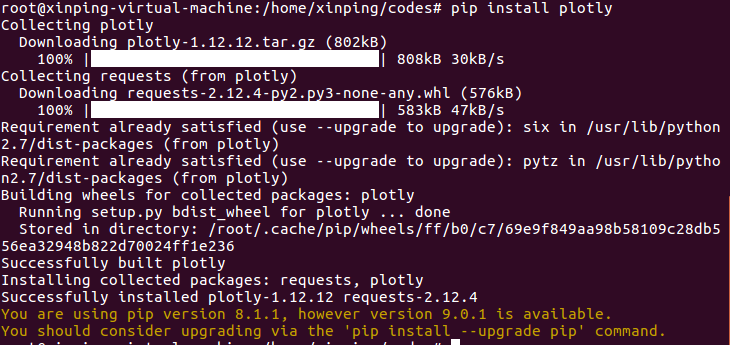
安装Plotly的Python安装包,需要使用pip命令来安装,安装命令如下。
sudo pip install plotly
如果安装成功会下图所示。
如果要升级Plotly模块,使用以下命令来升级。
pip install plotly --upgrade
2 初始化在线绘图
Plotly提供了在线服务,首先需要去以下的官网去注册一个账号
https://plot.ly/ssu/
然后在线生成一个私钥 API Key, 这里可以使用我已经注册的账户和私钥。
账户: templarz
API Key : PtKMjV9gAzINZqmQRU4T
在python交互环境下运行以下初始化命令,生成认证的安全文件 .plotly/.credentials。
import plotly
plotly.tools.set_credentials_file(username='templarz', api_key='PtKMjV9gAzINZqmQRU4T')
初始化生成的Plotly的安全文件.plotly/.credentials在home目录下,在~/.plotly/.credentials下。在文件中会看到以下内容,就说明初始化命令起作用了。
{
    "username": "templarz",
    "stream_ids": [],
    "api_key": "PtKMjV9gAzINZqmQRU4T",
    "proxy_username": "",
    "proxy_password": ""
}~
注意:
文中使用的开发环境是Ubuntu,如果是在Windows环境生成的安全文件,那么它所在的位置会有所不同。
3 例子1 生成在线折线图
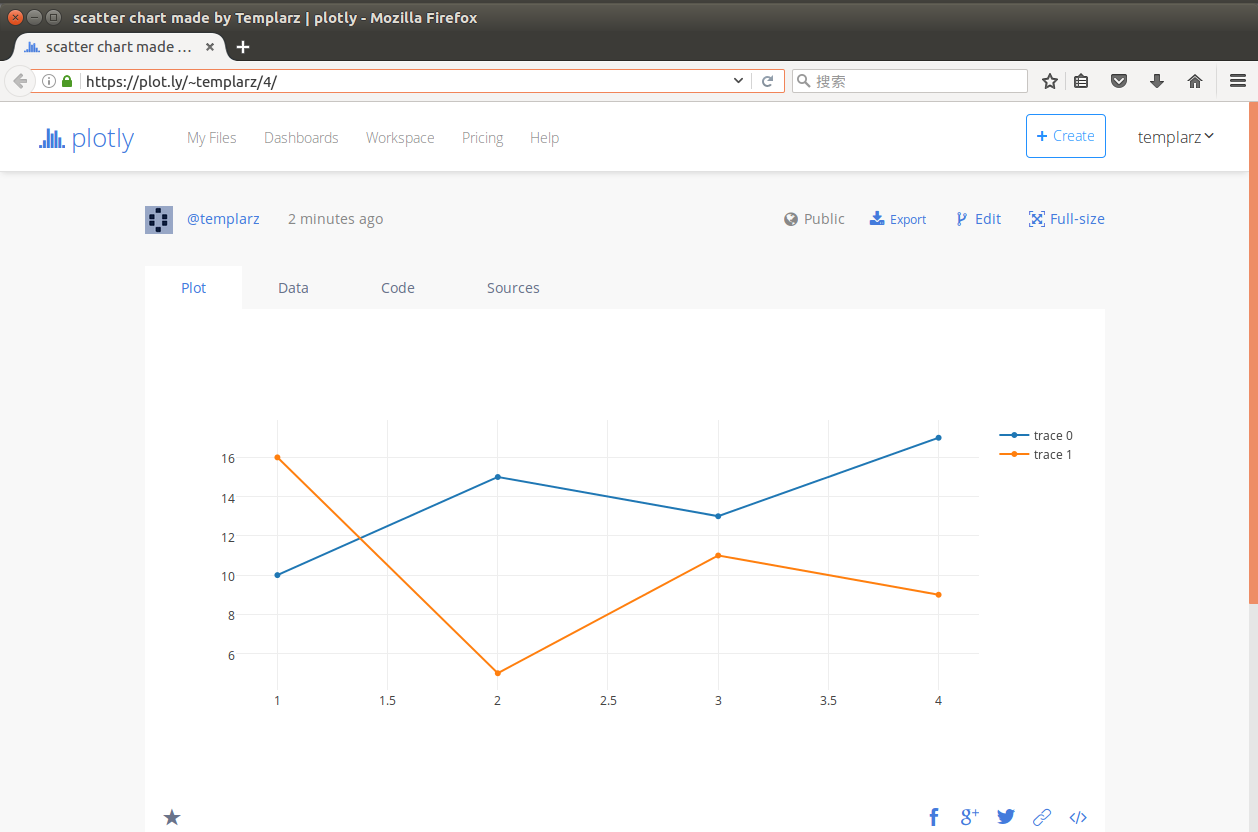
当使用Plotly web服务时,生成的plot和数据会保存到你的云账户中,下面的例子运行后会生成一个独一无二的url地址,通过这个地址可以访问你生成的plot图形。
import plotly.plotly as py
from plotly.graph_objs import *

trace0 = Scatter(
    x=[1, 2, 3, 4],
    y=[10, 15, 13, 17]
)
trace1 = Scatter(
    x=[1, 2, 3, 4],
    y=[16, 5, 11, 9]
)
data = Data([trace0, trace1])

py.plot(data, filename = 'basic-line')
运行以上那段代码后,会生成在浏览器中打开地址https://plot.ly/%7Etemplarz/4/ 地址,在云账户templarz中显示生成的plot图形如下图所示。
使用以下命令查看py.plot的api使用方法。
import plotly.plotly as py
help(py.plot)
输入后得到以下消息提示。
Help on function plot in module plotly.plotly.plotly:

plot(figure_or_data, validate=True, **plot_options)
    Create a unique url for this plot in Plotly and optionally open url.

    plot_options keyword agruments:
    filename (string) -- the name that will be associated with this figure
    fileopt ('new' | 'overwrite' | 'extend' | 'append') -- 'new' creates a
        'new': create a new, unique url for this plot
        'overwrite': overwrite the file associated with `filename` with this
        'extend': add additional numbers (data) to existing traces
        'append': add additional traces to existing data lists
    auto_open (default=True) -- Toggle browser options
        True: open this plot in a new browser tab
        False: do not open plot in the browser, but do return the unique url
    sharing ('public' | 'private' | 'secret') -- Toggle who can view this
                                                  graph
        - 'public': Anyone can view this graph. It will appear in your profile
                    and can appear in search engines. You do not need to be
                    logged in to Plotly to view this chart.
        - 'private': Only you can view this plot. It will not appear in the
                     Plotly feed, your profile, or search engines. You must be
                     logged in to Plotly to view this graph. You can privately
                     share this graph with other Plotly users in your online
                     Plotly account and they will need to be logged in to
                     view this plot.
        - 'secret': Anyone with this secret link can view this chart. It will
                    not appear in the Plotly feed, your profile, or search
                    engines. If it is embedded inside a webpage or an IPython
                    notebook, anybody who is viewing that page will be able to
                    view the graph. You do not need to be logged in to view
                    this plot.
    world_readable (default=True) -- Deprecated: use "sharing".
                                     Make this figure private/public

>>>
资料参考:
https://plot.ly/python/getting-started/
http://www.cnblogs.com/chaosimple/p/4153083.html