matlab绘制散点图
clc,clear
x=[11.9,11.5,14.5,15.2,15.9,16.3,14.6,12.9,15.8,14.1];
y=[196.84,196.84,197.14,197.03,197.05,197.13,197.04,196.96,196.95,196.98];
plot(x,y,'.')

Matlab将坐标系中的点连接起来
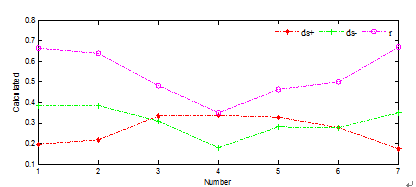
matlab绘制点线图
U
V
R=V./(U+V)
%图形展示出来
x=[1 2 3 4 5 6 7];
plot(x,U,'-.R*','LineWidth',2);
hold on;
plot(x,V,'-.G+','LineWidth',2);
hold on;
plot(x,R,'-.Mo','LineWidth',2);
%hold on;
%grid on;
xlabel('Number');
ylabel('Recognition rate (%)');
matlab:对单个矩阵plot绘图的说明
实例:a=magic(5)
a =
17 24 1 8 15
23 5 7 14 16
4 6 13 20 22
10 12 19 21 3
11 18 25 2 9
plot(a)
grid on

x=rand(10,1,40); % 随机取40个数 一个当横坐标 一个当纵坐标
y=rand(10,1,40);
%画图
plot(x( 1:10),y( 1:10),'r.');hold on; % 点    r=红色
plot(x(11:20),y(11:20),'g*');hold on; % 星星  g=绿色
plot(x(21:30),y(21:30),'o');hold on;  % 圆圈  默认是蓝色
plot(x(31:40),y(31:40),'mo','MarkerSize',15) % 大大的圆圈  m=紫色
分别按行组和行列绘制三维条形图
Y = round(rand(5,3)*10); %随机函数产生5*3的数组,对产生的数据取整
subplot(2,2,1)
bar(Y,'group')
title 'Group'
subplot(2,2,2)
bar(Y,'stack') %堆型二维垂直条形图
title 'Stack'
subplot(2,2,3)
barh(Y,'stack') %堆型二维水平条形图
title 'Stack'
subplot(2,2,4)
bar(Y,1.5) %设定条形的宽度为1.5
title 'Width = 1.5'
效果如图

Y = [1 2 3 4 5 6 7;
1 2 3 4 3 2 1;
76 5 4 3 2 1];
subplot(3,2,1)
bar3(Y,'detached')
title('Detached')
subplot(3,2,2)
bar3(Y,0.25,'detached')
title('Width = 0.25')
subplot(3,2,3)
bar3(Y,'grouped')
title('Grouped')
subplot(3,2,4)
bar3(Y,0.5,'grouped')
title('Width = 0.5')
subplot(3,2,5)
bar3(Y,'stacked')
title('Stacked')
subplot(3,2,6)
bar3h(Y,0.3,'stacked')
title('Width = 0.3')
效果如图

Matlab将坐标系中的点连接起来
- clc; clear all; close all;
- y=[60,58,55,53,53,53,51,50,49,46,41,41,41,40,39,40,40,40];
- x=[229,230,231,232,232,233,234,235,235,237,239,239,239,240,241,241,240,240];
- figure; hold on; box on;
- [x1, ind] = sort(x);
- y1 = y(ind);
- [b1, m1, n1] = unique(x1, 'first');
- xt = linspace(min(x), max(x));
- yt = interp1(x1(m1), y1(m1), xt, 'spline');
- plot(xt, yt, 'r-');
- plot(x, y, 'k*')