本文地址:https://www.cnblogs.com/veinyin/p/14744293.html
项目需求,实现立体柱状图,基于 echarts 实现,如下图
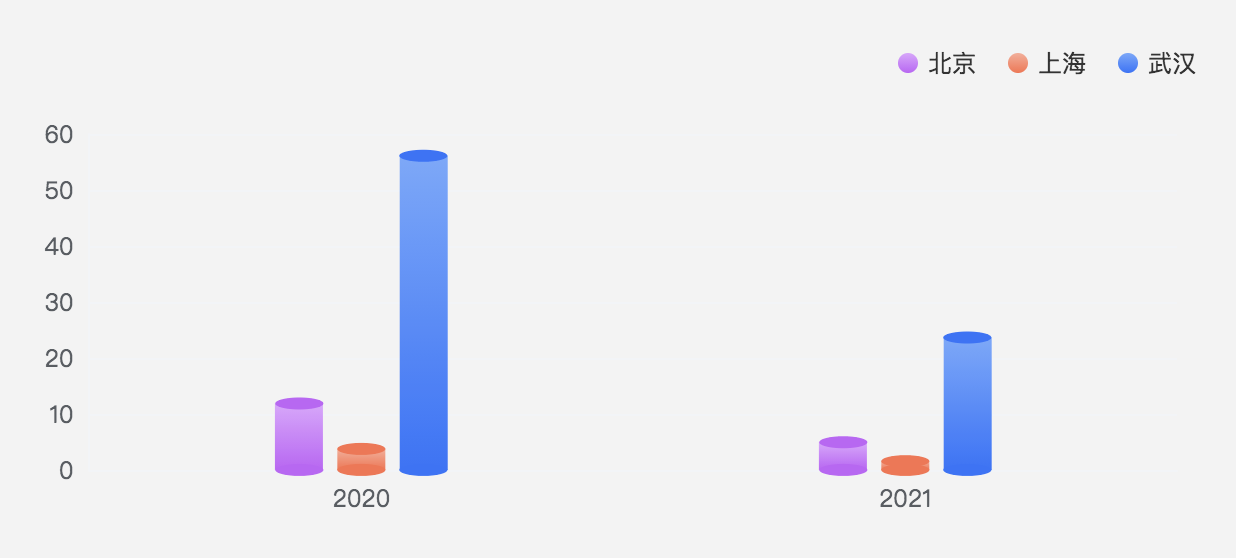
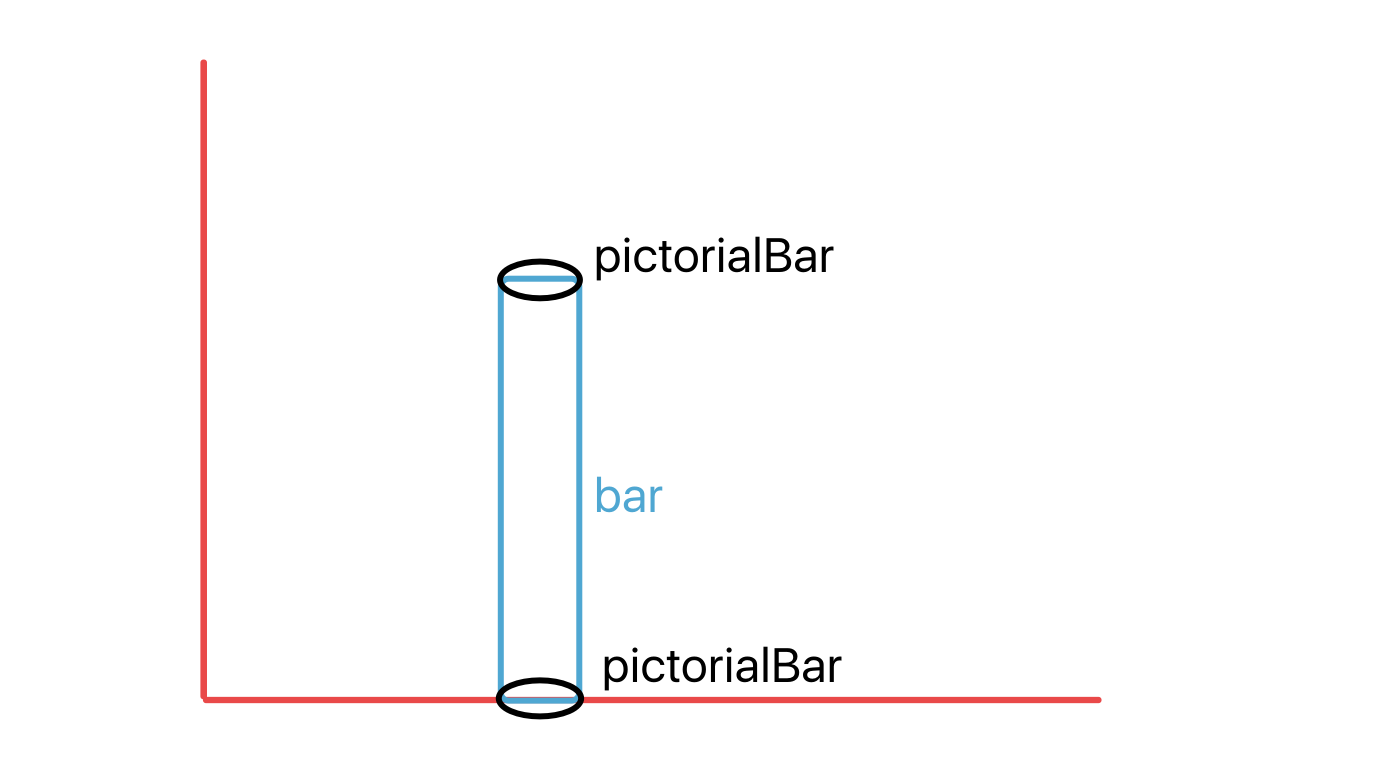
思路:普通柱状图(bar) + 象形柱图(pictorialBar),参考 demo
需求中柱状图是分组的,因此还是给一下具体配置项如下,只是稍微修改了一点内容,几个重要的地方加了注释,可直接贴在 echarts 实例中看效果
 option = {
    tooltip: {
        trigger: 'axis',
        confine: true,
        axisPointer: { type: 'none' },
        textStyle: { fontSize: 12, fontWeight: 500 },
        formatter(params) {
            // 只展示柱子对应的内容,把顶部底部的 tooltip 过滤掉
            return params.reduce((pre, i) => {
                if (i.componentSubType === 'bar') {
                    i.marker = i.marker.replace(/[object Object]/, i.color.colorStops[1].color);
                    i.value = `<span style="flex: 1; text-align: right; margin-left: 16px;">${i.value}</span>`;
                    const current = `<div style="display: flex; align-items: center; height: 26px;">${i.marker}${i.seriesName} ${i.value}</div>`;
                    return `${pre}${current}`;
                }
                return pre;
            }, '');
        },
    },
    legend: {
        data: ['武汉', '北京', '上海'],
        right: 10,
        top: 12,
        type: 'scroll',
        icon: 'circle',
        itemWidth: 10,
        itemHeight: 10,
        itemGap: 16,

        // 因为柱子顶部和底部是通过 offset 跟柱子结合起来的,如果取消选中,柱子数量变化,又要重新计算 offset,为了简单点就直接禁掉了
        selectedMode: false,
    },
    grid: { left: '3%', right: '4%', bottom: '5%', containLabel: true },
    xAxis: {
        type: 'category',
        data: ['2020', '2021'],
        axisLine: { lineStyle: { color: '#F2F4F7' } },
        axisTick: { show: false },
        axisLabel: { color: '#585D63' },
    },
    yAxis: {
        boundaryGap: [0, 0.01],
        axisLine: { lineStyle: { color: '#F2F4F7' } },
        axisTick: { show: false },
        axisLabel: { color: '#585D63' },
        splitLine: { lineStyle: { color: '#F2F4F7' } },
    },
    series: [
        {
            name: '武汉',
            type: 'bar',
            barWidth: 24,
            barCategoryGap: 12,
            data: ['11.8651', '4.9385'],
            itemStyle: {
          // 柱体渐变色
                color: new echarts.graphic.LinearGradient(0, 0, 0, 1, [
                    {
                        offset: 0,
                        color: '#E1A4FF',
                    },
                    {
                        offset: 1,
                        color: '#C65FF9',
                    },
                ])
            },
        },
        {
            name: '武汉',
            type: 'pictorialBar',
            symbolSize: [24, 6],

            // 这个属性很重要,直接决定了顶部跟柱子是否契合
            symbolOffset: [-31, -3],

            z: 12,
            itemStyle: { color: '#C65FF9' },
            symbolPosition: 'end',

            // 要给成武汉这两个柱子的值,这是圆柱顶部,值不给对高度会对不上
            data: ['11.8651', '4.9385'],
        },
        {
            name: '武汉',
            type: 'pictorialBar',
            symbolSize: [24, 6],
            symbolOffset: [-31, 3],
            z: 12,
            itemStyle: { color: '#C65FF9' },
            symbolPosition: 'start',

       // 这个给成大于 0 的值就行,设置了 position,一定会在柱子底部展示
            data: [1, 1],
        },
        {
            name: '北京',
            type: 'bar',
            barWidth: 24,
            barCategoryGap: 12,
            data: ['3.7493', '1.5536'],
            itemStyle: {
                color: new echarts.graphic.LinearGradient(0, 0, 0, 1, [
                    {
                        offset: 0,
                        color: '#FFAC97',
                    },
                    {
                        offset: 1,
                        color: '#FF704C',
                    },
                ])
            },
        },
        {
            name: '北京',
            type: 'pictorialBar',
            symbolSize: [24, 6],
            symbolOffset: [0, -3],
            z: 12,
            itemStyle: { color: '#FF704C' },
            symbolPosition: 'end',
            data: ['3.7493', '1.5536'],
        },
        {
            name: '北京',
            type: 'pictorialBar',
            symbolSize: [24, 6],
            symbolOffset: [0, 3],
            z: 12,
            itemStyle: { color: '#FF704C' },
            symbolPosition: 'start',
            data: ['3.7493', '1.5536'],
        },
        {
            name: '上海',
            type: 'bar',
            barWidth: 24,
            barCategoryGap: 12,
            data: ['56.1131', '23.6478'],
            itemStyle: {
                color: new echarts.graphic.LinearGradient(0, 0, 0, 1, [
                    {
                        offset: 0,
                        color: '#71A8FE',
                    },
                    {
                        offset: 1,
                        color: '#2872FC',
                    },
                ])
            },
        },
        {
            name: '上海',
            type: 'pictorialBar',
            symbolSize: [24, 6],
            symbolOffset: [31, -3],
            z: 12,
            itemStyle: { color: '#2872FC' },
            symbolPosition: 'end',
            data: ['56.1131', '23.6478'],
        },
        {
            name: '上海',
            type: 'pictorialBar',
            symbolSize: [24, 6],
            symbolOffset: [31, 3],
            z: 12,
            itemStyle: { color: '#2872FC' },
            symbolPosition: 'start',
            data: ['56.1131', '23.6478'],
        },
    ],

    // legend 对应的 color,实际上柱状图的颜色都是在 itemStyle 里定义的
    color: ['#C65FF9', '#FF704C', '#2872FC'],
}