监控Spring Boot应用

在Spring Boot应用中,既然通过HTTP使用Actuator的监控和管理功能,那么在pom.xml文件中,除了引入spring-boot-starter-web之外,还需要引入spring-boot-starter-actuator,具体代码如下:
    <dependency>
        <groupId>org.springframework.boot</groupId>
        <artifactId>spring-boot-starter-actuator</artifactId>
    </dependency>
Spring Boot提供了许多监控和管理功能的端点。根据端点的作用,可以将Spring Boot提供的原生端点分为三大类:应用配置端点、度量指标端点和操作控制端点。
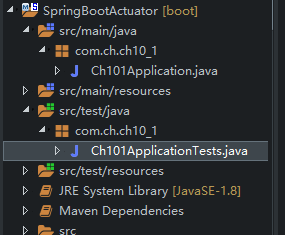
端点的开启与暴露

通过实例查看Spring Boot默认暴露的端点。

查看Spring Boot默认暴露的端点。

1.创建基于Spring Boot Actuator的Web应用ch10_1

2.配置JSON输出格式

3.启动主程序查看默认暴露的端点
<project xmlns="http://maven.apache.org/POM/4.0.0"
    xmlns:xsi="http://www.w3.org/2001/XMLSchema-instance"
    xsi:schemaLocation="http://maven.apache.org/POM/4.0.0 http://maven.apache.org/xsd/maven-4.0.0.xsd">
    <modelVersion>4.0.0</modelVersion>
    <groupId>com.actuator</groupId>
    <artifactId>SpringBootActuator</artifactId>
    <version>0.0.1-SNAPSHOT</version>

    <parent>
        <groupId>org.springframework.boot</groupId>
        <artifactId>spring-boot-starter-parent</artifactId>
        <version>2.0.0.RELEASE</version>
        <relativePath /> <!-- lookup parent from repository -->
    </parent>

    <properties>
        <!-- 声明项目配置依赖编码格式为 utf-8 -->
        <project.build.sourceEncoding>UTF-8</project.build.sourceEncoding>
        <project.reporting.outputEncoding>UTF-8</project.reporting.outputEncoding>
        <fastjson.version>1.2.24</fastjson.version>
    </properties>

    <dependencies>

        <dependency>
            <groupId>org.springframework.boot</groupId>
            <artifactId>spring-boot-starter-actuator</artifactId>
        </dependency>

        <dependency>
            <groupId>org.springframework.boot</groupId>
            <artifactId>spring-boot-starter-web</artifactId>
        </dependency>

        <dependency>
            <groupId>org.springframework.boot</groupId>
            <artifactId>spring-boot-starter-test</artifactId>
            <scope>test</scope>
        </dependency>

    </dependencies>

    <build>
        <plugins>
            <plugin>
                <artifactId>maven-compiler-plugin</artifactId>
                <configuration>
                    <source>1.8</source>
                    <target>1.8</target>
                </configuration>
            </plugin>
        </plugins>
    </build>
</project>
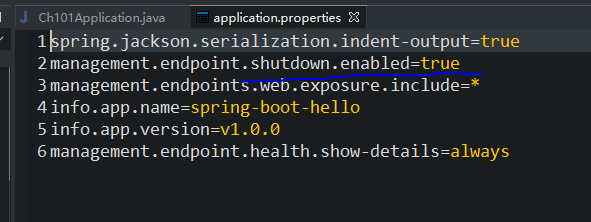
#输出的JSON字符串格式更美观
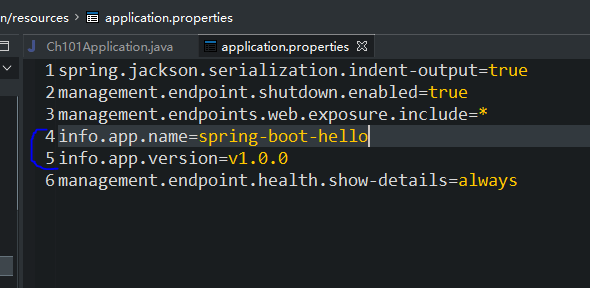
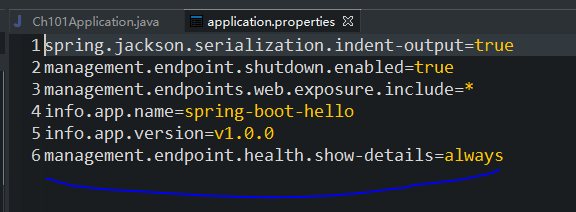
spring.jackson.serialization.indent-output=true
management.endpoint.shutdown.enabled=true
management.endpoints.web.exposure.include=*
#management.endpoints.web.exposure.exclude=env,beans
info.app.name=spring-boot-hello
info.app.version=v1.0.0
#将详细健康信息显示给所有用户
management.endpoint.health.show-details=always
package com.ch.ch10_1;

import org.springframework.boot.SpringApplication;
import org.springframework.boot.autoconfigure.SpringBootApplication;

@SpringBootApplication
public class Ch101Application {
    public static void main(String[] args) {
        SpringApplication.run(Ch101Application.class, args);
    }
}
package com.ch.ch10_1;

import org.junit.Test;
import org.junit.runner.RunWith;
import org.springframework.boot.test.context.SpringBootTest;
import org.springframework.test.context.junit4.SpringRunner;

@RunWith(SpringRunner.class)
@SpringBootTest
public class Ch101ApplicationTests {
    @Test
    public void contextLoads() {
    }
}
启动Web应用ch10_1的主程序Ch101Application后,通过访问“http://localhost:8080/actuator”查看默认暴露的端点,运行效果如图
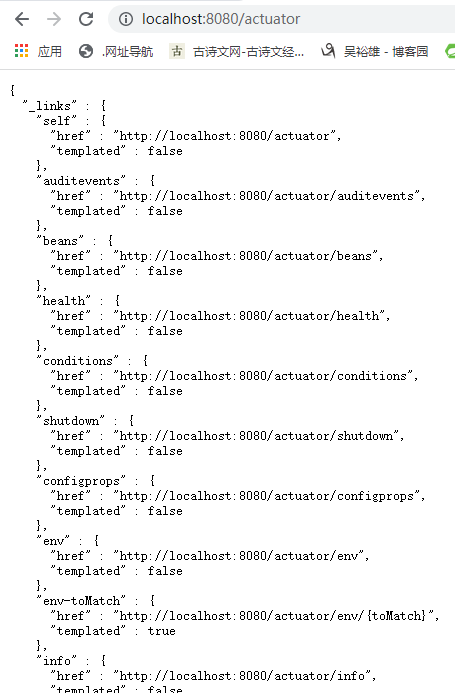
Spring Boot默认暴露了health和info两个端点。如果想暴露Spring Boot提供的所有端点,需要在配置文件application.properties配置“management.endpoints.web.exposure.include=*”,配置后重启应用主程序,重新访问“http://localhost:8080/actuator”就可以查看所有暴露的端点
    默认情况下,除了shutdown端点是关闭的,其它端点都是开启的。配置一个端点的开启,使用management.endpoint..enabled属性,如启用shutdown端点:
management.endpoint.shutdown.enabled=true
    我们在配置文件中可使用“management.endpoints.web.exposure.include”属性列出暴露的端点,示例如下:
management.endpoints.web.exposure.include=info,health,env,beans
    “*”可用来表示所有的端点,例如,除了env和beans端点,通过HTTP暴露所有端点,示例如下:
    management.endpoints.web.exposure.include=*
management.endpoints.web.exposure.exclude=env,beans
应用配置端点的测试

    通过应用配置端点就可以帮助我们轻松的获取一系列关于Spring应用配置内容的详细报告,比如:自动化配置的报告、Bean创建的报告、环境属性的报告等。
1.conditions
2.beans
3.configprops
4.env
5.mappings
6.info
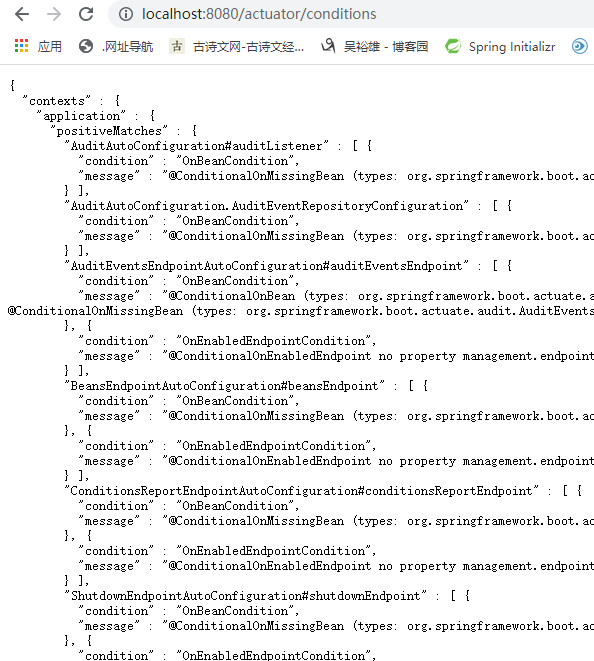
1.conditions

    该端点在1.x版本中名为autoconfig,该端点用来获取应用的自动化配置报告,其中包括所有自动化配置的候选项。同时还列出了每个候选项自动化配置的各个先决条件是否满足。所以,该端点可以帮助我们方便的找到一些自动化配置为什么没有生效的具体原因。该报告内容将自动化配置内容分为三部分:positiveMatches中返回的是条件匹配成功的自动化配置;negativeMatches中返回的是条件匹配不成功的自动化配置;unconditionalClasses无条件配置类。启动并暴露该端点后,可通过“http://localhost:8080/actuator/conditions”测试访问。
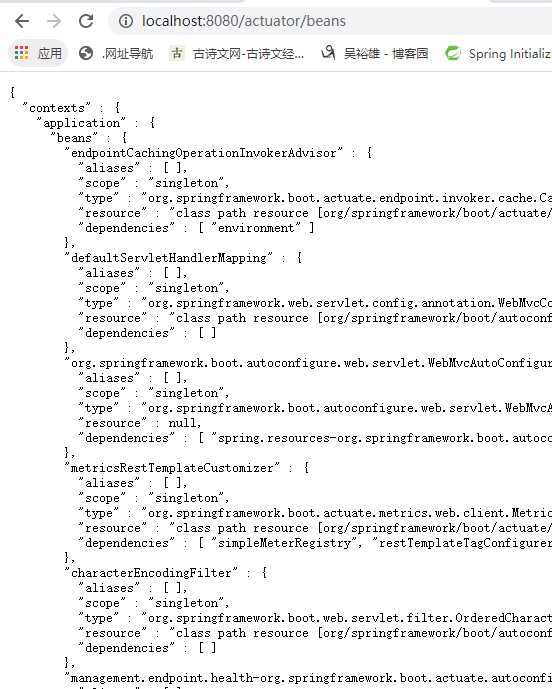
2.beans

该端点用来获取应用上下文中创建的所有Bean,启动并暴露该端点后,可通过“http://localhost:8080/actuator/beans”测试访问
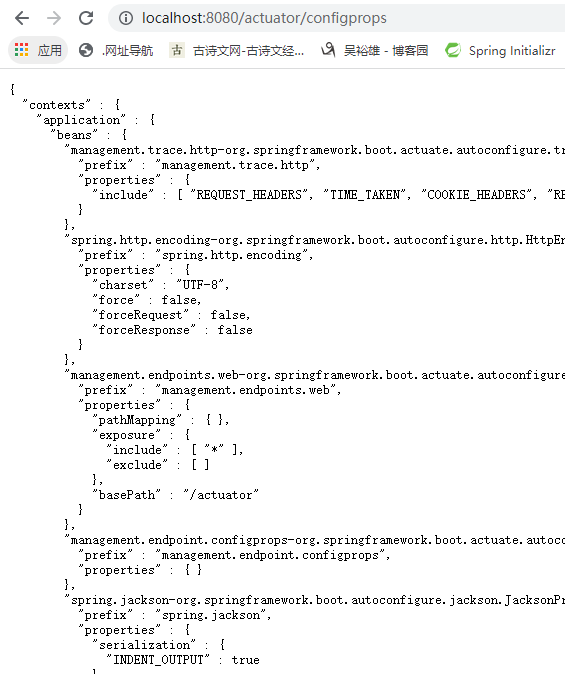
3.configprops

该端点用来获取应用中配置的属性信息报告,prefix属性代表了属性的配置前缀,properties代表了各个属性的名称和值,例如可以设置spring.http.encoding.charset="UTF-8"。启动并暴露该端点后,可通过“http://localhost:8080/actuator/configprops”测试访问
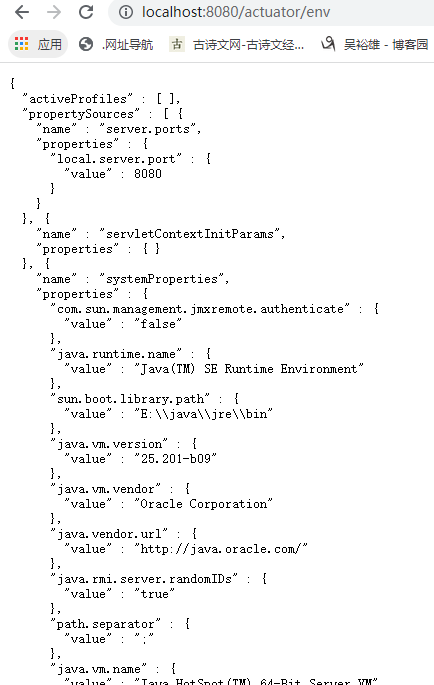
4.env

该端点与configprops端点不同,它用来获取应用所有可用的环境属性报告。包括:环境变量、JVM属性、应用的配置、命令行中的参数等内容。启动并暴露该端点后,可通过“http://localhost:8080/actuator/env”测试访问
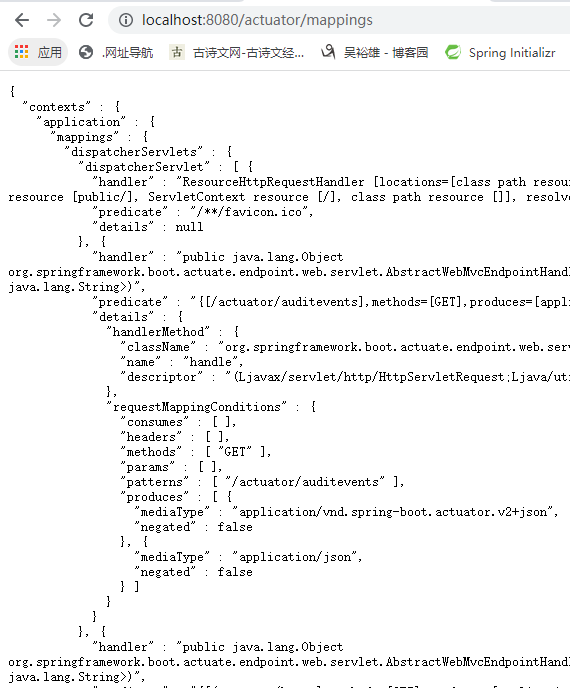
5.mappings

该端点用来返回所有Spring MVC的控制器映射关系报告。启动并暴露该端点后,可通过“http://localhost:8080/actuator/mappings”测试访问
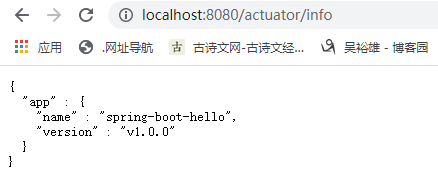
6.info

该端点用来返回一些应用自定义的信息。默认情况下,该端点只会返回一个空的json内容。我们可以在application.properties配置文件中通过info前缀来设置一些属性。比如:
    info.app.name=spring-boot-hello
info.app.version=v1.0.0
启动并暴露该端点后,可通过“http://localhost:8080/actuator/info”
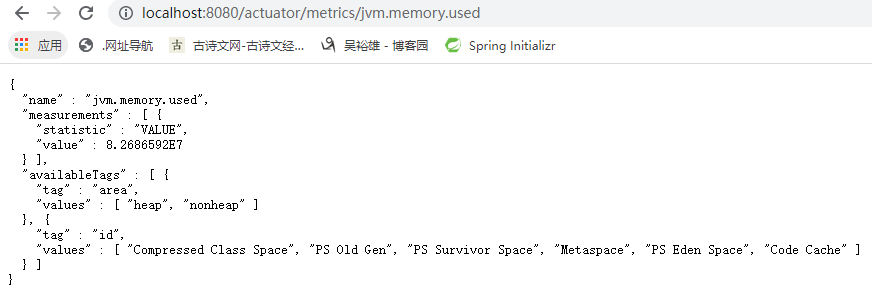
1.metrics

该端点用来返回当前应用的各类重要度量指标,比如:内存信息、线程信息、垃圾回收信息等。启动并暴露该端点后,可通过“http://localhost:8080/actuator/metrics”测试访问
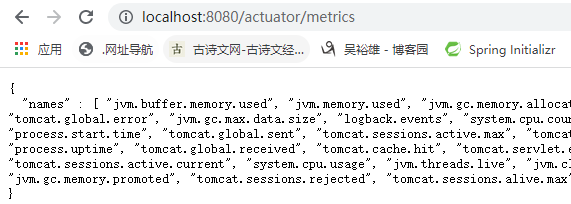
metrics端点可以提供应用运行状态的完整度量指标报告,这项功能非常的实用,但是对于监控系统中的各项监控功能,它们的监控内容、数据收集频率都有所不同,如果我们每次都通过全量获取报告的方式来收集,略显粗暴。所以,我们还可以通过/metrics/{name}接口来更细粒度的获取度量信息,比如我们可以通过访问/metrics/jvm.memory.used来获取当前JVM使用的内存数量
2.health

该端点用来获取应用的各类健康指标信息。在spring-boot-starter-actuator模块中自带实现了一些常用资源的健康指标检测器。这些检测器都是通过HealthIndicator接口实现,并且根据依赖关系的引入实现自动化装配,比如用于检测磁盘的DiskSpaceHealthIndicator、检测DataSource连接是否可用的DataSourceHealthIndicator等。
启动并暴露该端点后,可通过“http://localhost:8080/actuator/health”测试访问
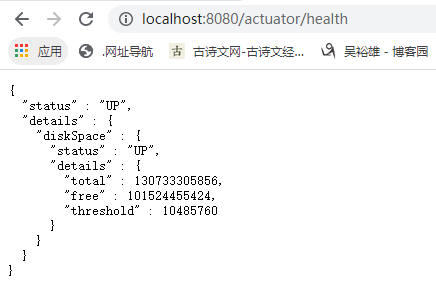
我们可以在配置文件中,配置属性management.endpoint.health.show-details=always,将详细健康信息显示给所有用户。再次启动应用后,刷新http://localhost:8080/actuator/health,显示健康指标详细信息
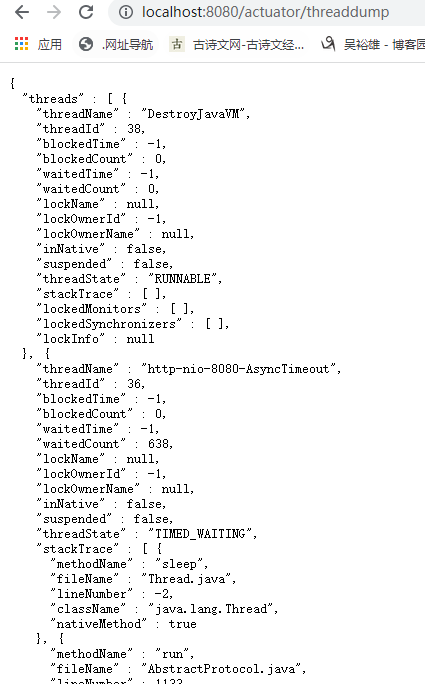
3.threaddump

该端点用来暴露程序运行中的线程信息。它使用java.lang.management.ThreadMXBean的dumpAllThreads方法来返回所有含有同步信息的活动线程详情。启动并暴露该端点后,可通过“http://localhost:8080/actuator/threaddump”测试访问
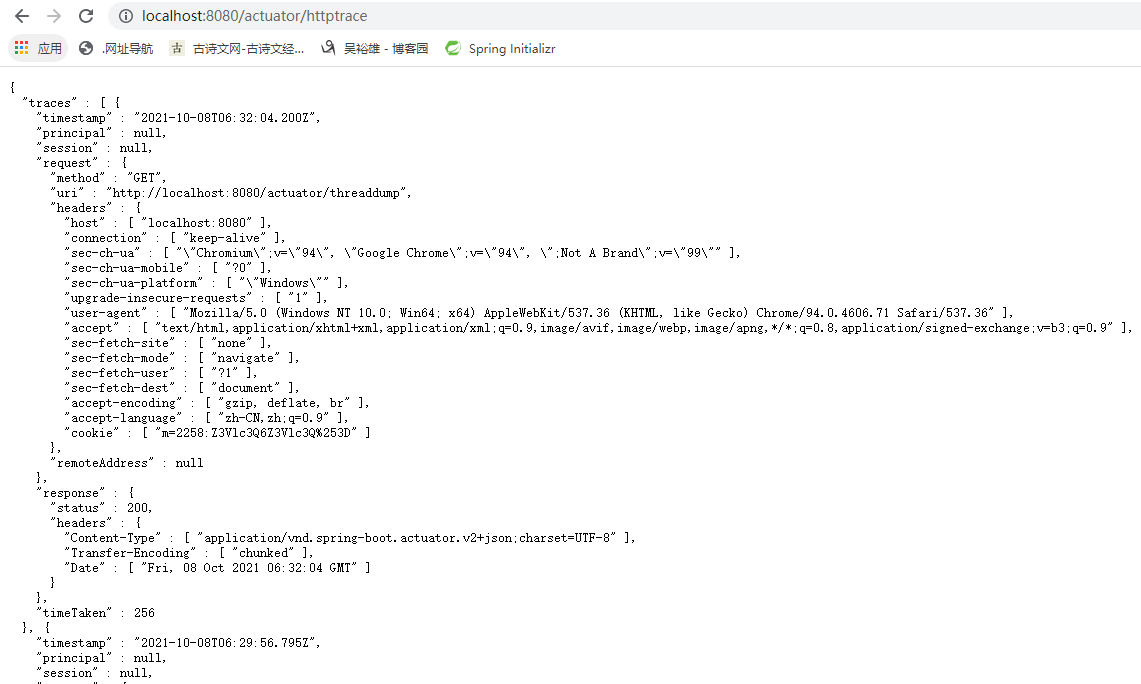
4.httptrace

该端点用来返回基本的HTTP跟踪信息。默认情况下,跟踪信息的存储采用org.springframework.boot.actuate.trace.InMemoryTraceRepository实现的内存方式,始终保留最近的100条请求记录。启动并暴露该端点后,可通过“http://localhost:8080/actuator/httptrace”测试访问
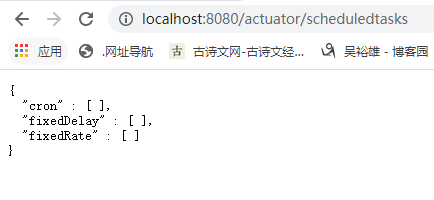
5.scheduledtasks

该端点统计应用程序中调度的任务。启动并暴露该端点后,可通过“http://localhost:8080/actuator/scheduledtasks”测试访问
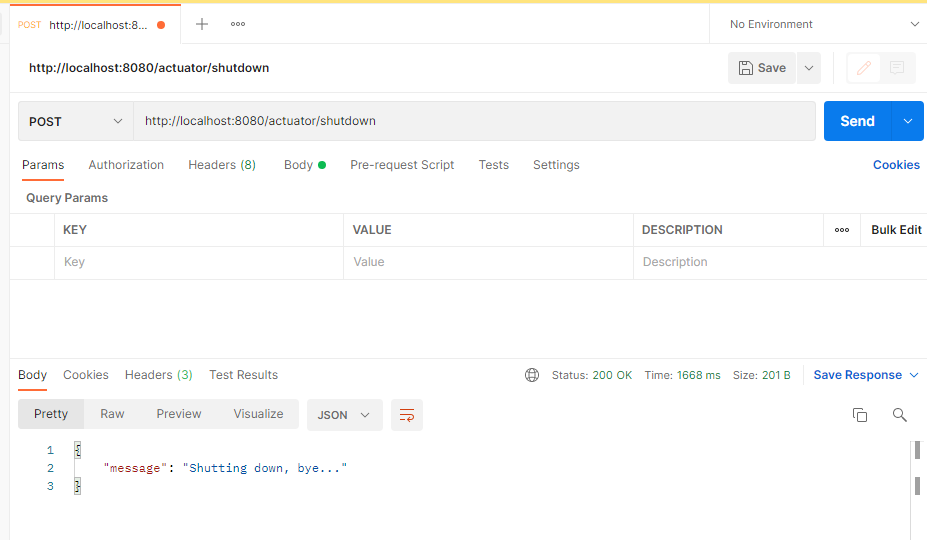
操作控制端点的测试

操作控制类端点拥有更强大的控制能力,如果使用它们,需要通过属性来配置开启。在原生端点中,只提供了一个用来关闭应用的端点:shutdown。我们可以通过如下配置开启它:management.endpoint.shutdown.enabled=true,在配置了上述属性之后,只需要访问该应用的shutdown端点就能实现关闭该应用的远程操作。由于开放关闭应用的操作本身是一件非常危险的事,所以真正在线上使用的时候,需要对其加入一定的保护机制,比如:定制Actuator的端点路径、整合Spring Security进行安全校验等。
    shutdown端点不支持get提交,不可以直接在浏览器上访问,所以我们这里可以使用rest-client-master来测试。用post方式访问“http://localhost:8080/actuator/shutdown”