| 这个作业属于哪个课程 | <2020春W班 (福州大学)> |
|---|---|
| 这个作业要求在哪里 | <作业要求> |
| 结对学号 | <221701412、221701420> |
| 这个作业的目标 | <某次疫情统计可视化的实现> |
| 作业正文 | <作业正文> |
| 其他参考文献 | <echarts、springboot官方开发文档、天行数据> |
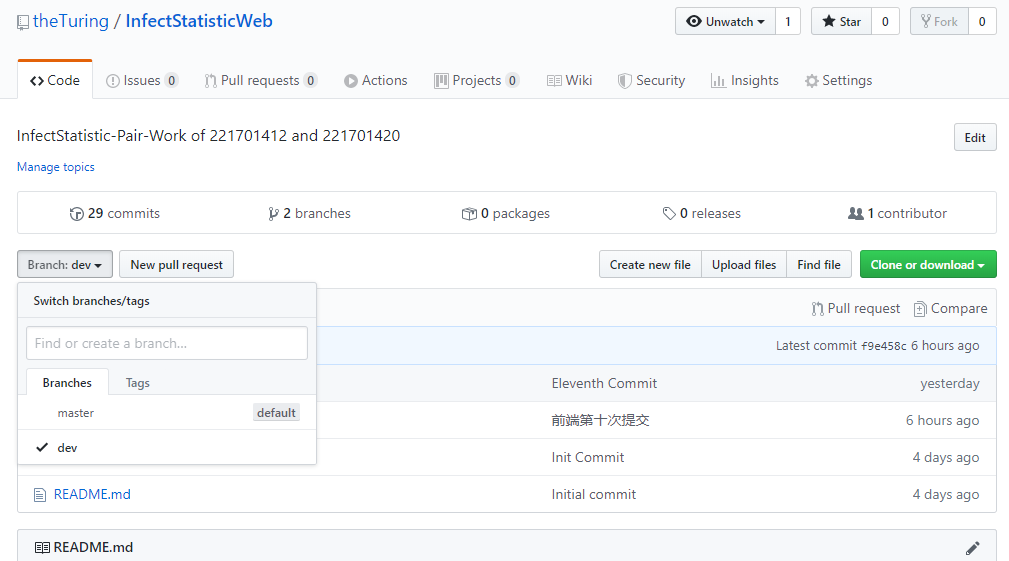
Part.01 结对合作Github仓库地址和代码规范
在文章开头给出Github仓库地址和代码规范链接
-
Github仓库地址 “https://github.com/theTuring/InfectStatisticWeb” <点击进入>
-
221701412的代码规范链接 “My coolstyle.md” <点击进入>
-
221701420的代码规范链接 “My coolstyle.md” <点击进入>
-
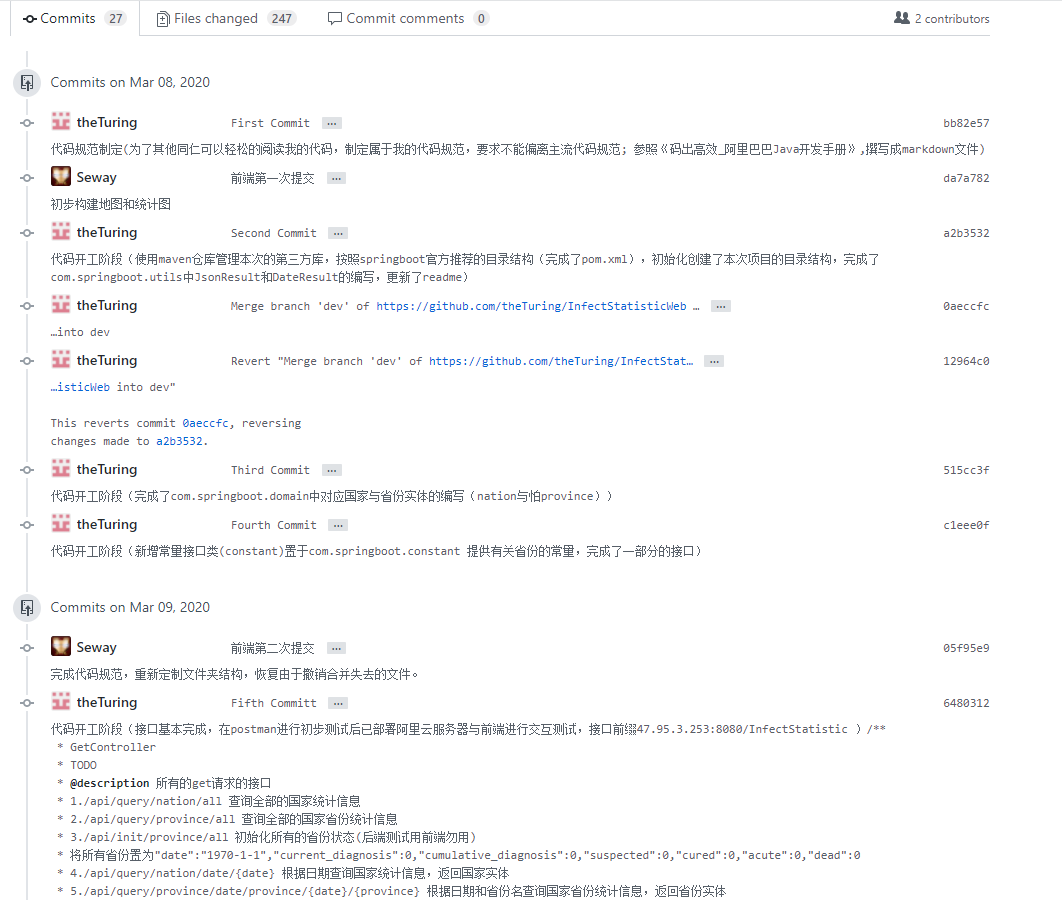
创建仓库分dev支,先在dev分支上开发
-
二人在仓库合作开发
Part.02 成品展示
展示你的成品,要求提供10张以上的图片,或者采用GIF或者视频嵌入的方式来展示作业要求的功能。如果部署到云服务器上,可以一并给出链接
-
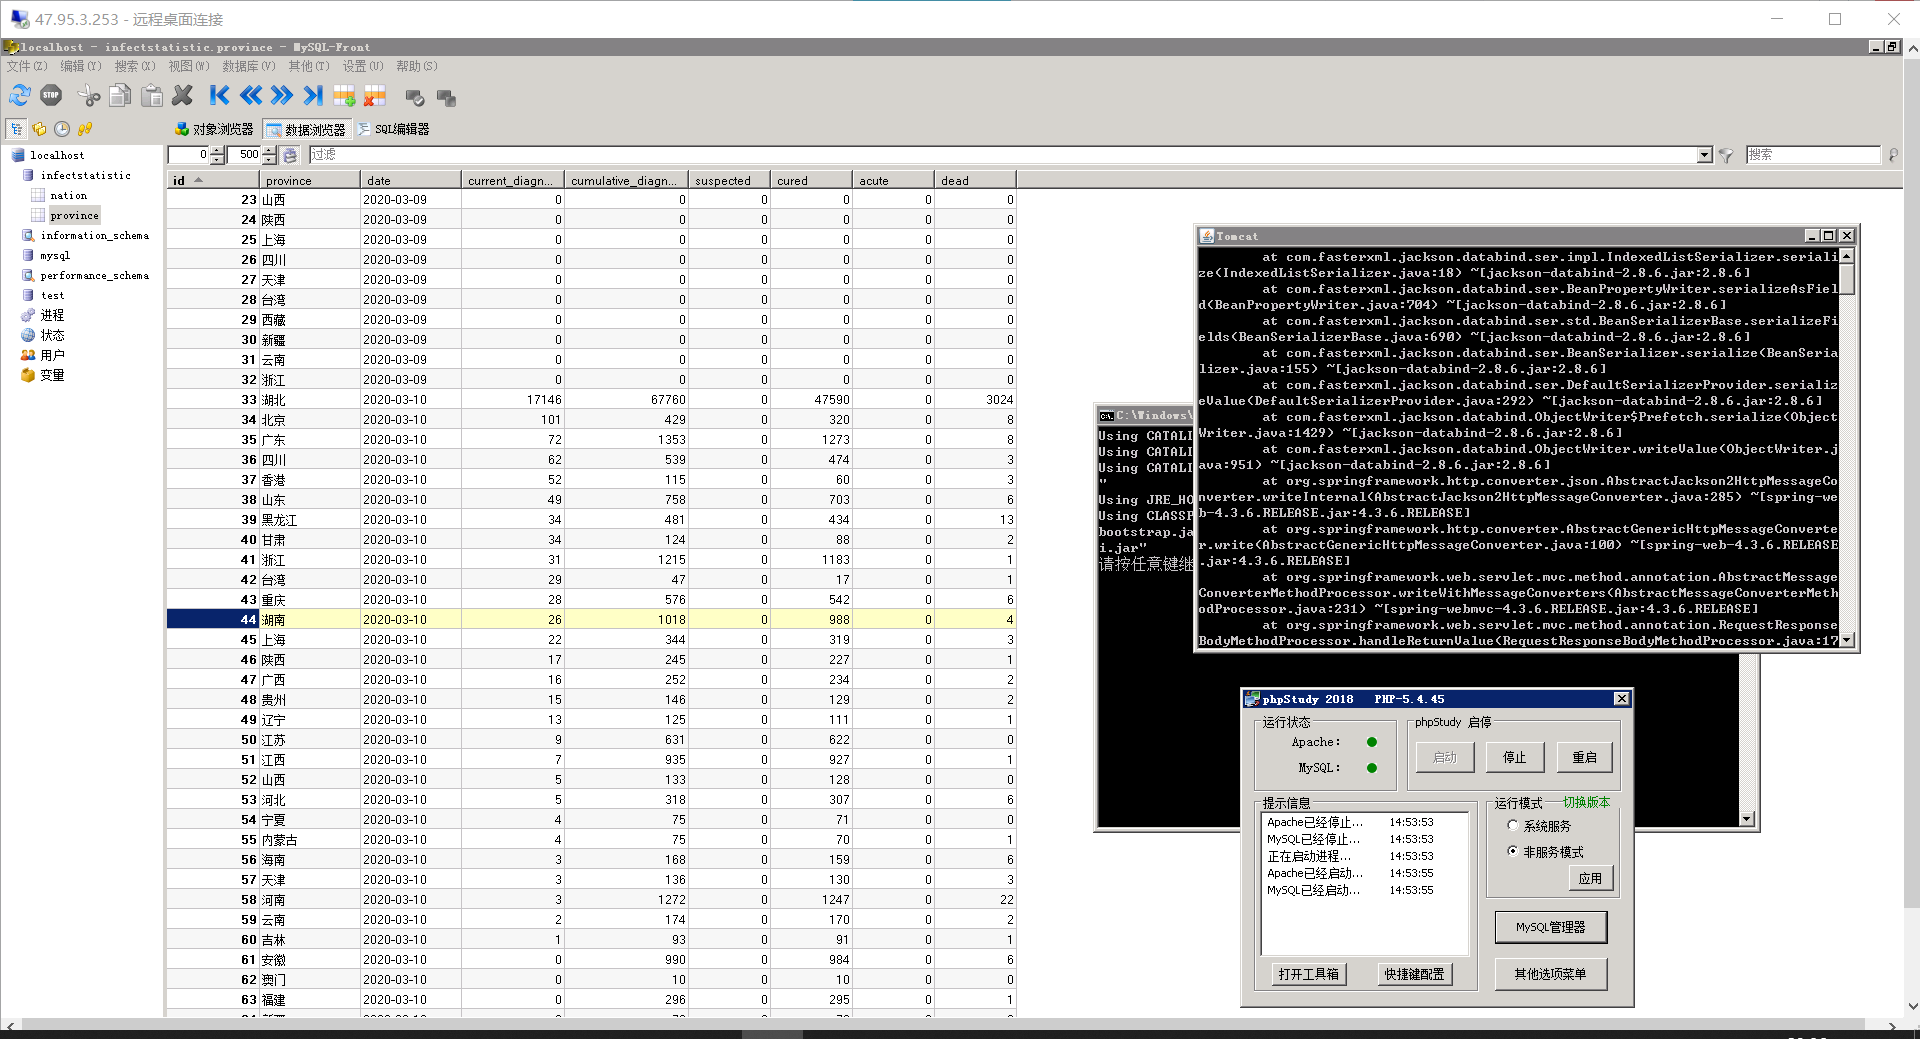
阿里云服务器地址 “http://47.95.3.253:8080” <点击进入>
-
统计爬取了2020-02-12至今日的所有的真实数据
-
ps:建议使用火狐货谷歌浏览器访问(服务器几年前买的学生机,比较卡)
-
将项目前后端部署到了阿里云服务器(window server2008系统)上,使用 tomcat9.0 + phpstudy + nginx配置服务器
-
功能1:实现通过地图的形式来直观显示疫情的大致分布情况,还可以查看具体省份的疫情统计情况
- 可以选择具体的日期

- 在全国地图上使用不同的颜色代表大概确诊人数区间
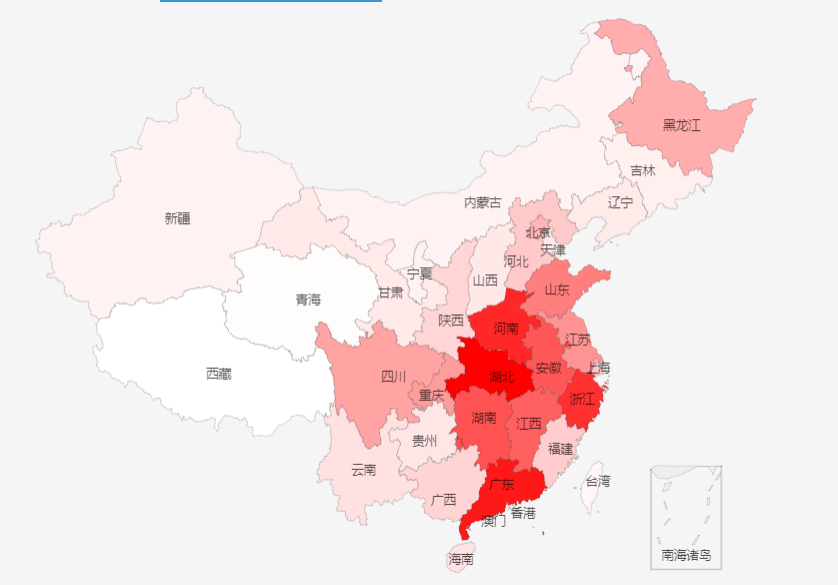
- 颜色的深浅表示疫情的严重程度,可以直观了解高危区域

- 鼠标移到每个省份会高亮显示;点击鼠标会显示该省具体疫情情况
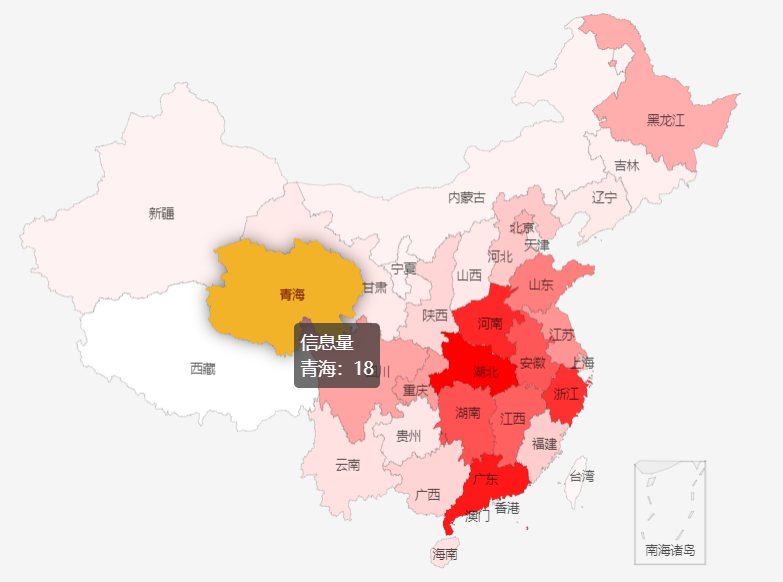
- 效果总览
- 可以选择具体的日期
-
功能2:点击某个省份显示该省疫情的具体情况
- 可以选择具体的日期

- 显示该省份对应的感染患者人数、疑似患者人数、治愈人数、死亡人数

- 该省份到目前为止的新增确诊趋势、新增疑似趋势、治愈趋势和死亡趋势;绘制该省份的趋势变化曲线图
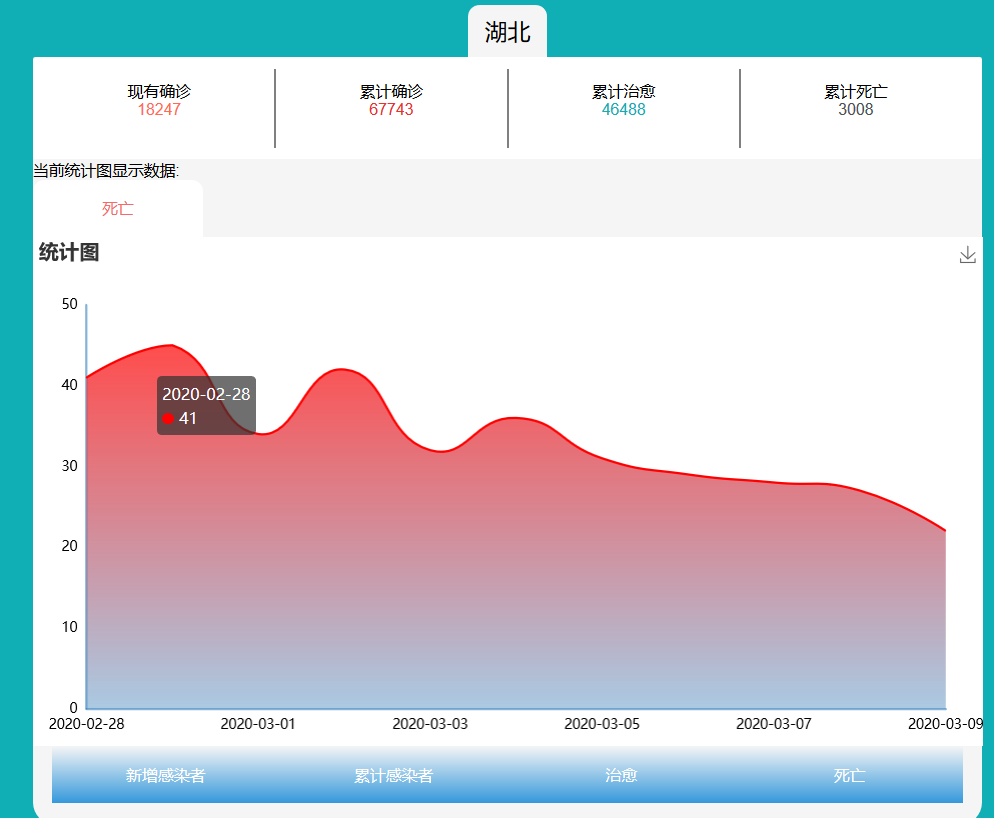
- 效果总览
- 可以选择具体的日期
-
拓展功能:当日最新热点新闻模块

Part.03 结对讨论过程
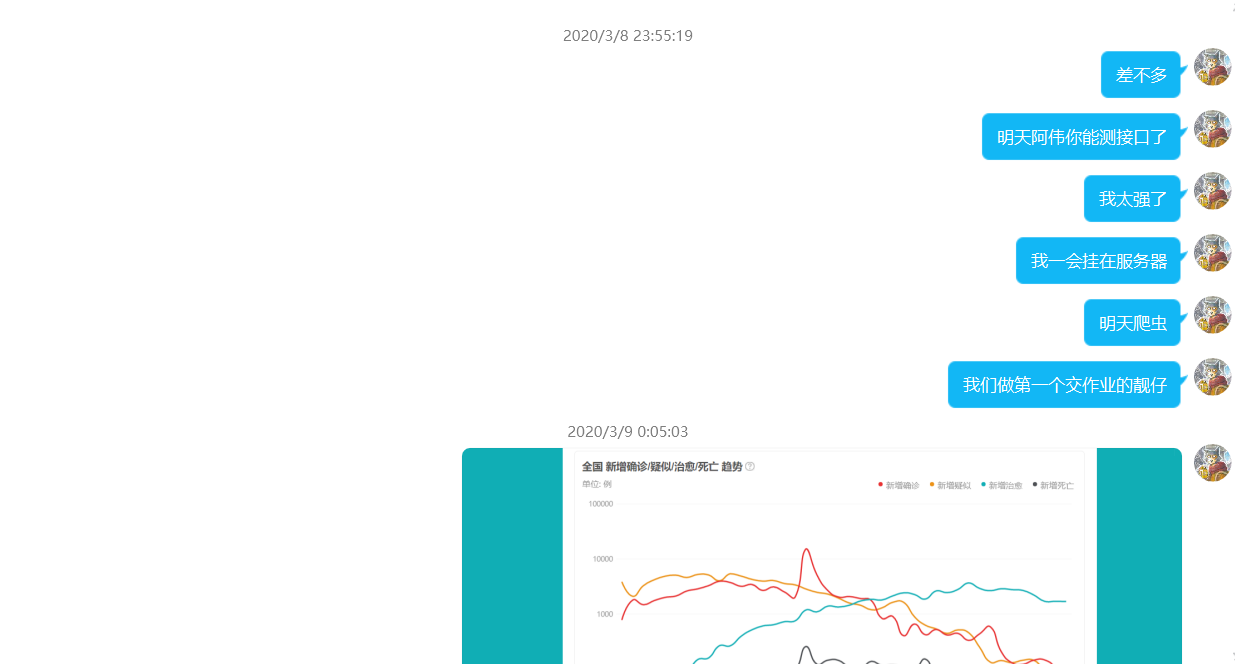
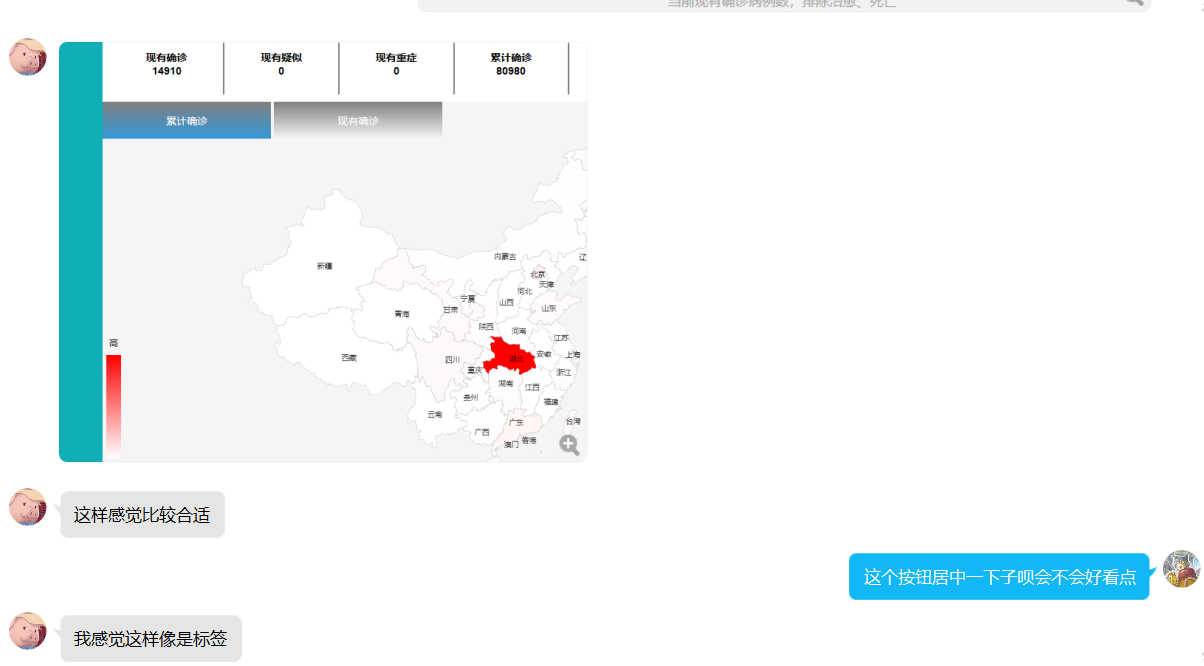
结对讨论过程描述,即刚开始拿到题目后,和队友怎么讨论,解决问题和查找资料的过程,并提供两人结对讨论的截图
-
分工前后端分离,221701412负责后端使用springboot写接口,使用postman初步测试后直接挂在服务器提供接口,221701420负责前端界面编写
-
获得了实时数据,项目有所进展

-
后端基本完工,将接口的功能文档提供给前端使用

-
对于接口的讨论


-
增加新的接口


-
关于界面的修改讨论


Part.04 设计实现过程
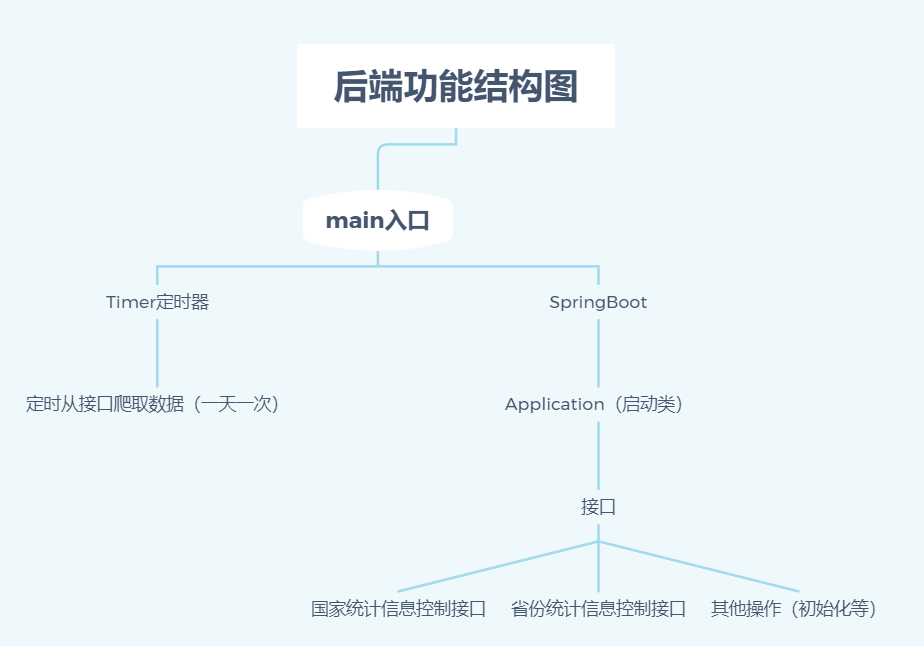
描述设计实现过程,给出功能结构图
221701412-后端
-
1.确定项目基本结构
使用 springboot 作为基本框架,maven 做为包管理器,jackson 用来封装 json 数据以及筛选 json 数据。
-
2.爬取数据
从网络上找到可爬取的接口进行爬取数据,解析存入数据库
-
3.前后端交互
前后端交互通过http接口,由后端为前端提供接口文档
-
4.功能结构图
221701420-前端
-
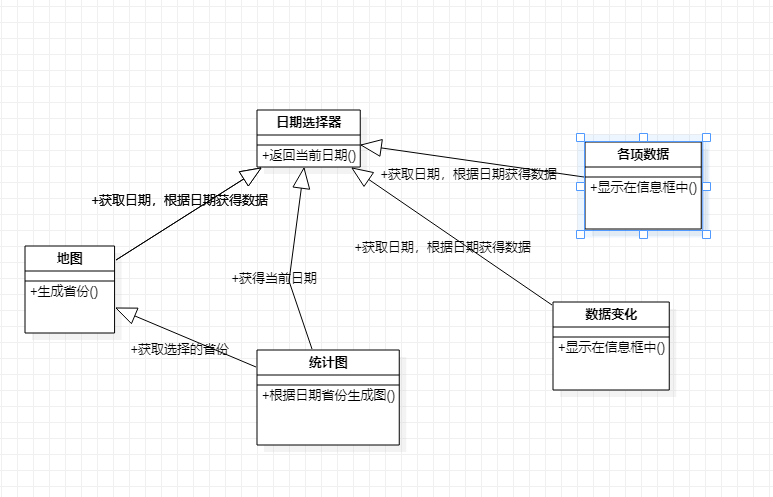
1.日期选择器
设计一个日期选择器,选择想要看的数据的日期
-
2.地图模块
根据日期生成全国地图,在全国地图上使用不同的颜色代表大概确诊人数区间,颜色的深浅表示疫情的严重程度,可以直观了解高危区域;点击鼠标会显示该省具体疫情情况;具体展现为统计图
-
3.统计图模块
根据在地图选择的省份和日期选择器的日期,生成一份统计图展示该省份在选择日期最近几天的数据变化情况
-
4.新闻模块
展示每日的热点新闻
-
5.实现后台脚本
- 使用layui提供的日期选项框在前端生成选择器,然后对其功能进行包装以适应本次的开发。
- 根据日期选项框提供的日期生成一个可以点击省份查看详细信息,展示基本数据的地图,在点击省份后触发统计图模块更新数据。
- 使用地图提供的省份名以及日期选择器提供的日期,访问接口获得详细数据装载统计图。
- 在日期改变时触发更新地图和统计图的事件。
-
6.功能结构图
Part.05 关键代码
代码说明。展示出项目关键代码,300行左右,并解释思路
221701412-后端
-
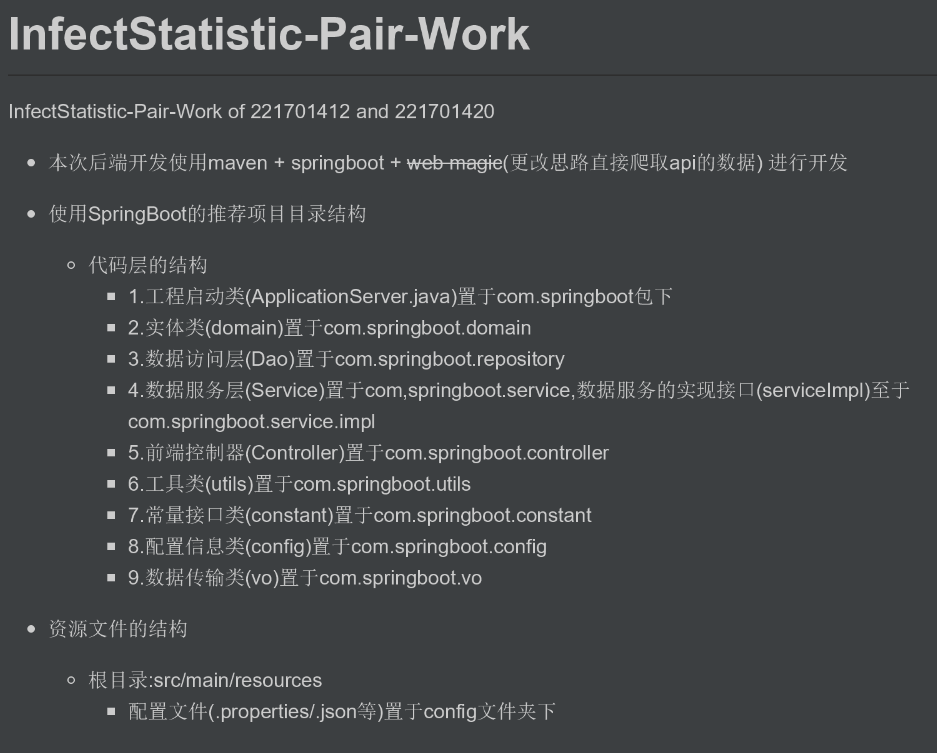
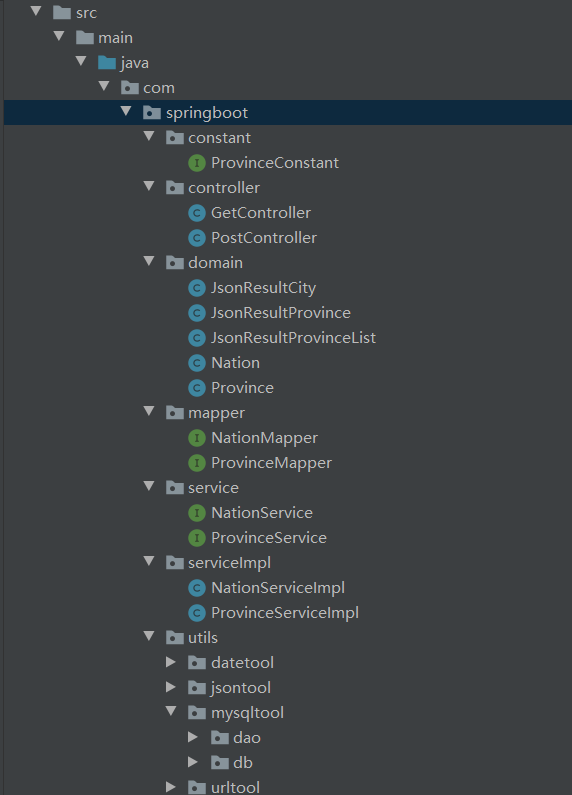
本次后端目录结构使用spring boot官方推荐的目录结构
-
启动类及定时器
@SpringBootApplication
//exclude表示自动配置时不包括Multipart配置
@EnableAutoConfiguration(exclude = {MultipartAutoConfiguration.class})
@ServletComponentScan
public class InfectStatisticApplication extends SpringBootServletInitializer{

    public static void main(String[] args) throws SQLException {

        // 创建定时器
        Timer timer = new Timer();

        timer.schedule(new TimerTask() {
            // 在run方法中的语句就是定时任务执行时运行的语句。
            public void run() {

                //json解析类实例化
                AnalysisJson analysisJson = new AnalysisJson();

                try {
                    analysisJson.TimerExecute();
                } catch (SQLException e) {
                    e.printStackTrace();
                }


            }
            // 表示在3秒之后开始执行,并且每8640秒(一天)执行一次
        }, 3000, 1000 * 60 * 60 * 24);


//        SpringApplication.run(InfectStatisticApplication.class, args);

    }

    @Override
    protected SpringApplicationBuilder configure(SpringApplicationBuilder builder) {
        return builder.sources(InfectStatisticApplication.class);
    }

    /**
     * ajax跨域
     */
    @Bean
    public WebMvcConfigurer webMvcConfigurer() {
        return new WebMvcConfigurerAdapter() {
            @Override
            public void addCorsMappings(CorsRegistry registry) {
                registry.addMapping("/**").allowedOrigins("*");
            }
        };
    }
}
-
解析接口
 //解析全国省份城市统计的json
    public static List<JsonResultProvince> ProvinceJson() {

        Gson gson=new Gson();

        //http://api.tianapi.com/txapi/ncovcity/index?key=6e07e5626fdebe0394ff896b6bdb52a3
        String json_temp = HttpRequest.sendGet("http://api.tianapi.com/txapi/ncovcity/index?key=6e07e5626fdebe0394ff896b6bdb52a3");

        //解析对象:第一个参数:待解析的字符串 第二个参数结果数据类型的Class对象
        JsonResultProvinceList jsonResultBooksList=gson.fromJson(json_temp, JsonResultProvinceList.class);

        return jsonResultBooksList.getNewslist();

    }
-
mapper层
@Mapper
public interface NationMapper {

    //查询全部
    @Select("select * from nation")
    List<Nation> getAllNation();

    //日期date查找
    @Select("SELECT * FROM nation WHERE date =#{date}")
    Nation queryNationByDate(String date);

    //添加国家统计信息
    @Insert("INSERT INTO nation (date, current_diagnosis, cumulative_diagnosis, suspected, cured, acute, dead) "
            + "VALUES (#{date}, #{current_diagnosis}, #{cumulative_diagnosis}, #{suspected}, #{cured}, #{acute}, #{dead})")
    int insertNation(Nation nation);

}

@Mapper
public interface ProvinceMapper {

    //查询全部
    @Select("select * from province")
    List<Province> getAllProvince();

    //省份名province和日期date查找
    @Select("SELECT * FROM province WHERE province =#{province} AND date =#{date}")
    Province queryEvRecordByBoth(@Param("province") String province, @Param("date") String date);

    //日期date查找
    @Select("SELECT * FROM province WHERE date =#{date}")
    List<Province> queryEvRecordByDate(String date);

    //添加省份统计信息
    @Insert("INSERT INTO province (province, date, current_diagnosis, cumulative_diagnosis, suspected, cured, acute, dead) "
            + "VALUES (#{province}, #{date}, #{current_diagnosis}, #{cumulative_diagnosis}, #{suspected}, #{cured}, #{acute}, #{dead})")
    int insertProvince(Province province);
}
-
controller层(接口)
/**
 * GetController
 * TODO
 * @description 所有的get请求的接口
 * 0./api/init/province/all/date/{date} 初始化某一时间点所有的省份状态(后端测试用前端勿用)
 * 1./api/query/nation/all 查询全部的国家统计信息
 * 2./api/query/province/all 查询全部的国家省份统计信息
 * 3./api/init/province/all 初始化所有的省份状态(后端测试用前端勿用)
 * 将所有省份置为"date":"1970-01-01","current_diagnosis":0,"cumulative_diagnosis":0,"suspected":0,"cured":0,"acute":0,"dead":0
 * 4./api/query/nation/date/{date} 根据日期查询国家统计信息,返回国家实体
 * 5./api/query/province/date/province/{date}/{province} 根据日期和省份名查询国家省份统计信息,返回省份实体
 * 6./api/query/province/city/all 直接查询查看即时的国家省份城市统计信息(api获取)
 * 7./api/query/news 直接查询即时热点信息(api获取)
 * 8./api/query/nation/increase/{date} 根据日期查询国家统计信息,返回国家当日增加实体
 * 9./api/query/province/increase/{date}/{province} 根据日期查询国家省份统计信息,返回对应省份当日增加实体
 * 10./api/query/province/date/{date} 根据日期查询国家省份统计信息,返回省份list
 * 11./api/query/province/increase/date1_to_date2/{date1}/{date2}/{province} 根据日期查询国家省份统计信息,返回一个时间段对应省份当日增加实体
 * @author 221701412_theTuring
 * @version v 1.0.0
 * @since 2020.3.8
 */
@RestController
@CrossOrigin
@RequestMapping("/api")
public class GetController implements ProvinceConstant{

    @Autowired
    private NationService nationService;

    @Autowired
    private ProvinceService provinceService;

    //初始化所有的省份状态
    @RequestMapping("init/province/all/date/{date}")
    public JsonResult initProvinceDateAll(@PathVariable String date) {

        //实例化省份的实体
        Province province = new Province();

        for(int i=0; i<PROVINCE_NUM; i++){

            province.setProvince(PROVINCES[i]);
            province.setDate(date);
            province.setCurrent_diagnosis(INIT_NUM);
            province.setCumulative_diagnosis(INIT_NUM);
            province.setSuspected(INIT_NUM);
            province.setAcute(INIT_NUM);
            province.setCured(INIT_NUM);
            province.setDead(INIT_NUM);

            int temp = provinceService.insertProvince(province);

        }

        return JsonResult.build(200,"success",null);

    }

    //mysql单类型查询()
    @RequestMapping("query/nation/all")
    public JsonResult queryNationAll() {

        List<Nation> list = this.nationService.getAllNation();

        return JsonResult.ok(list);

    }

    //mysql单类型查询()
    @RequestMapping("query/province/all")
    public JsonResult queryProvinceAll() {

        List<Province> list = this.provinceService.getAllProvince();

        return JsonResult.ok(list);

    }
............(省略取一部分)
221701420-前端
-
dateFormat()函数:返回一个符合“year-month-day”格式的日期,日期为日期选项框的值
//返回选项框的日期
function dateFormat(){
    var date=document.getElementById("time").value;
        //修理日期未生成时产生的接口访问错误bug

    if(date==''){
        var temp=new Date();
        var years=temp.getFullYear();
        var month=temp.getMonth();
        month++;
        if(month<10) month='0'+month;
        var days=temp.getDate();
        if(days<10) days='0'+days;
        date=years+'-'+month+'-'+days;
    }
   return date;
}
-
setMap()函数:根据dateFormat()返回的日期访问接口获取数据并且生产全国疫情图
function setMap(set){

    var date=dateFormat();

    var myChart = echarts.init(document.getElementById('map'));

    //根据日期获取全国各省的情况
    axios.get('http://47.95.3.253:8080/InfectStatistic//api/query/province/date/'+date)
    .then(function (response) {
        var dataList=new Array();
        if(set=='现有确诊'){
            for(var i=0;i<34;i++){
                dataList[i]={
                    name:response.data.data[i].province,
                    value:response.data.data[i].current_diagnosis
                }
            }
        }
        else{
            for(var i=0;i<34;i++){
                dataList[i]={
                    name:response.data.data[i].province,
                    value:response.data.data[i].cumulative_diagnosis
                }
            }
        }
        //console.log(dataList);


        option = {
            tooltip: {
                formatter:function(params,ticket, callback){
                    return params.seriesName+'<br />'+params.name+':'+params.value
                }//数据格式化
            },
            visualMap: {
                min: 0,
                max: 1500,
                left: 'left',
                top: 'bottom',
                text: ['高','低'],//取值范围的文字
                inRange: {
                    color: ['#FFFFFF', '#FF0000']//取值范围的颜色
                },
                show:true//图注
            },
            geo: {
                map: 'china',
                roam: false,//不开启缩放和平移
                zoom:1.23,//视角缩放比例
                label: {
                    normal: {
                        show: true,
                        fontSize:'10',
                        color: 'rgba(0,0,0,0.7)'
                    }
                },
                itemStyle: {
                    normal:{
                        borderColor: 'rgba(0, 0, 0, 0.2)'
                    },
                    emphasis:{
                        areaColor: '#F3B329',//鼠标选择区域颜色
                        shadowOffsetX: 0,
                        shadowOffsetY: 0,
                        shadowBlur: 20,
                        borderWidth: 0,
                        shadowColor: 'rgba(0, 0, 0, 0.5)'
                    }
                }
            },
            series : [
                {
                    name: '信息量',
                    type: 'map',
                    geoIndex: 0,
                    data:dataList
                }
            ]
        };
        myChart.setOption(option,true);

        //点击地图上的省份显示详细信息
        myChart.on('click', function (params) {
            var pro=document.getElementById("province");
            pro.innerHTML=params.name;
            setChart();
            setBoxs();
        });


    })
    .catch(function (error) {
        console.log(date);
        console.log(error);
    });

}
-
setChart()函数:根据dateFormat()返回的日期和setMap()生产的地图中选中的省份访问接口获得数据生成统计图
function setChart(set){
    if(set==null||set==undefined){
        set=document.getElementById("chartName").value;
    }
    var date=new Date(Date.parse(dateFormat().replace(/-/g,  "/")));
    //相当于date2减去10天
    date-=10*24 * 60 * 60 * 1000;
    //月份格式化
    date=new Date(date);
    var month=date.getMonth();
    var day=date.getDate();
    month++;
    if(month<10) month='0'+month;
    if(day<10) day='0'+day;
    //访问接口的日期格式化
    var date1=date.getFullYear()+'-'+month+'-'+day;

    var date2=dateFormat();
    //获取省份
    province=document.getElementById("province").innerHTML;
    if(set==null||set==undefined) set=document.getElementById("chartName").value;
     //初始化图表
     var myChart = echarts.init(document.getElementById('chart'));
     //访问端口
    axios.get('http://47.95.3.253:8080/InfectStatistic/api/query/province/increase/date1_to_date2/'+date1+"/"+date2+"/"+province)
    .then(function (response) {
        // 指定图表的配置项和数据
        option = ({
            title: {
                text: '统计图'
            },
            tooltip: {
                trigger: 'axis'
            },
            legend: {
                data:['legend']
            },
            grid: {
                left: '3%',
                right: '4%',
                bottom: '3%',
                containLabel: true
            },
            toolbox: {
                feature: {
                saveAsImage: {}
            }
            },
            backgroundColor: 'white',
            xAxis: {
                type: 'category',
                axisTick:{
                    show:false,
                },
                boundaryGap: false,
                axisTick:{
                    show:false,
                },
                axisLabel:{
                    color:'black'
                },
                axisLine:{
                    lineStyle:{
                        color:'rgba(12,102,173,.5)',
                        2,
                    }
                },
            },
            yAxis: [
                {
                    type: 'value',
                    axisTick:{
                        show:false,//不显示刻度线
                    },
                    axisLabel:{
                        color:'black'  //y轴上的字体颜色
                    },
                    axisLine:{
                        lineStyle:{
                            2,
                            color:'rgba(12,102,173,.5)',//y轴的轴线的宽度和颜色
                        }
                    },
                    splitLine: {
                        show: false
                    }
                },
            ],
            series: [
                {
                    type:'line',
                    symbol: 'none',
                    smooth:true,
                    itemStyle: {
                        normal: {
                            color: 'red',
                        }
                    },
                    areaStyle: {
                        normal: {
                            color: new echarts.graphic.LinearGradient(0, 0, 0, 1, [{
                                offset: 0,
                                color: 'red'
                            }, {
                                offset: 1,
                                color: 'rgba(12,102,173,.5)'
                            }])
                        }
                    },
                }
            ]
        });
        //根据日期获取指定省份情况的情况
        var dataList=new Array();
        //x轴数据数组
        var xAxisData=new Array();

        for(var i=0;i<response.data.data.length;i++){
            if(set=="新增感染者"){
                dataList[i]=response.data.data[i].current_diagnosis;
                if(dataList[i]<0) dataList[i]=0;
            }
            else if(set=="累计感染者"){
                dataList[i]=response.data.data[i].cumulative_diagnosis;
                if(dataList[i]<0) dataList[i]=0;
            }
            else if(set=="治愈"){
                dataList[i]=response.data.data[i].cured;
                if(dataList[i]<0) dataList[i]=0;
            }
            else if(set=="死亡"){
                dataList[i]=response.data.data[i].dead;
                if(dataList[i]<0) dataList[i]=0;
            }
            //x轴为日期
            xAxisData[i]=response.data.data[i].date;

        }
        option.series[0].data = dataList;
        //x轴数据设定
        option.xAxis.data = xAxisData;
        myChart.setOption(option);
    });
}
-
change.js:根据dateFormat()返回的日期访问接口获取相较于昨天的数据变化并且显示在页面
function dataChange(){
    var date=dateFormat();
    if(date==''){
        var temp=new Date();
        var years=temp.getFullYear();
        var month=temp.getMonth();
        month++;
        if(month<10) month='0'+month;
        var days=temp.getDate();
        if(days<10) days='0'+days;
        date=years+'-'+month+'-'+days;
    }
    axios.get('http://47.95.3.253:8080/InfectStatistic//api/query/nation/increase/'+date)
    .then(function (response) {
        document.getElementById("nationExistDiagnosisChange").innerHTML=response.data.data.current_diagnosis;
        document.getElementById("nationExistSuspectsChange").innerHTML=response.data.data.suspected;
        document.getElementById("nationExistSevereChange").innerHTML=0;
        document.getElementById("nationCumulativeDiagnosisChange").innerHTML=response.data.data.cumulative_diagnosis;
        document.getElementById("nationCumulativeCureChange").innerHTML=response.data.data.cured;
        document.getElementById("nationCumulativeDeadChange").innerHTML=response.data.data.dead;
    })
}
-
setBox()函数:根据dateFormat()返回的日期获取访问接口获得当日的各项数据展示在网页
function setBoxs(){
    var date=dateFormat();

    axios.get('http://47.95.3.253:8080/InfectStatistic//api/query/nation/all')
    .then(function(response){
        for(var i=0;i<response.data.data.length;i++){
            if(response.data.data[i].date==date){
                document.getElementById("nationExistDiagnosis").innerHTML=response.data.data[i].current_diagnosis;
                document.getElementById("nationExistSuspects").innerHTML=response.data.data[i].suspected;
                document.getElementById("nationExistSevere").innerHTML=0;
                document.getElementById("nationCumulativeDiagnosis").innerHTML=response.data.data[i].cumulative_diagnosis;
                document.getElementById("nationCumulativeCure").innerHTML=response.data.data[i].cured;
                document.getElementById("nationCumulativeDead").innerHTML=response.data.data[i].dead;

            }
        }
    });
    axios.get('http://47.95.3.253:8080/InfectStatistic///api/query/province/all')
    .then(function(response){
        var pro=document.getElementById("province").innerHTML;
        for(var i=0;i<response.data.data.length;i++){
            if(response.data.data[i].date==date&&response.data.data[i].province==pro){

                document.getElementById("provinceExistDiagnosis").innerHTML=response.data.data[i].current_diagnosis;
                document.getElementById("provinceCumulativeDiagnosis").innerHTML=response.data.data[i].cumulative_diagnosis;
                document.getElementById("provinceCumulativeCure").innerHTML=response.data.data[i].cured;
                document.getElementById("provinceCumulativeDead").innerHTML=response.data.data[i].dead;
            }
        }
    });
}
-
news.js:访问接口获取当天的新闻显示在页面
axios.get('http://api.tianapi.com/txapi/ncov/index?key=6e07e5626fdebe0394ff896b6bdb52a3')
.then(function (response) {
    var news=document.getElementById("news");
    for(var i=0;i<response.data.newslist[0].news.length;i++){
        var node=document.createElement('div');
        var a=document.createElement('a');
        a.innerHTML=response.data.newslist[0].news[i].title;
        a.setAttribute("href",response.data.newslist[0].news[i].sourceUrl)
        node.appendChild(a);
        news.appendChild(node);
    }

})
.catch(function(error){
    console.log(error);
})
Part.06 心路历程与收获
阅读《构建之法》第四章至第五章的内容,结合在构建之法中学习到的相关内容,结对伙伴分别撰写结对开发项目的心路历程与收获,并评价结对队友
阅读心得
-
1.第四章心得
对于构建之法第四章里面所要求的两人合作的要求,本次疫情因素导致只能远程进行交流,所以我们采用了前后端分离,仅仅通过接口进行交互,使用了GitHub的合作仓库在dev分支上共同开发,对结对编程这种合作方法有了一定的新的体验。 -
2.第五章心得
在第五章提到 l 团队合作和流程这个对于我们接下来的团队项目将很有帮助。作为一个团队,要有一致的目标、明确的分工。首先这一点是最为关键的,在团队中要时刻注意和保持。
心路历程及收获
-
221701412
这次的作业比较大的收获应该是研究了spring boot的官网文档,增加了自己不少对该框架的认知,项目的目录结构也相对的更加规范,其次最大的难点就是对数据的获取,开始找了很多网站使用webmmagic爬取,渲染使用谷歌内核driver获得渲染网页,百度,360,丁香均只能获得当前数据,后来在天行数据找到了接口直接解析得到了前几日的数据,最后和队友成功完成作业,可喜可贺! -
221701420
这次的前端工作总体来说不难,但是如果真的要扩展许多功能就比较困难了,所以这次只制作了一个热点的扩展功能。在实现的过程中遇到许多问题,但是在队友和百度的帮助下,总算度过难关。可喜可贺!
对队友的评价
-
221701420
我的队友代码规范,易交流,即使我天天骚扰也不厌其烦 -
221701420
我的队友是一个学习能力很强的人,凡事亲历亲为,写的接口又好用,说话又好听