原文链接:http://tecdat.cn/?p=9670
样条线是拟合非线性模型并从数据中学习非线性相互作用的一种方法。
三次样条
三次样条 具有连续的一阶和二阶导数。 我们通过应用基础函数来变换变量 并使用这些变换后的变量拟合模型, 向模型添加非线性, 使样条曲线能够拟合更平滑 。
#loading the Splines Packages
require(splines)
#ISLR contains the Dataset
require(ISLR)
attach(Wage) #attaching Wage dataset
?Wage #for more details on the dataset
agelims<-range(age)
#Generating Test Data
age.grid<-seq(from=agelims[1], to = agelims[2])
三次样条
R中使用函数拟合三次样条。
#3 cutpoints at ages 25 ,50 ,60
fit<-lm(wage ~ bs(age,knots = c(25,40,60)),data = Wage )
summary(fit)
##
## Call:
## lm(formula = wage ~ bs(age, knots = c(25, 40, 60)), data = Wage)
##
## Residuals:
## Min 1Q Median 3Q Max
## -98.832 -24.537 -5.049 15.209 203.207
##
## Coefficients:
## Estimate Std. Error t value Pr(>|t|)
## (Intercept) 60.494 9.460 6.394 1.86e-10 ***
## bs(age, knots = c(25, 40, 60))1 3.980 12.538 0.317 0.750899
## bs(age, knots = c(25, 40, 60))2 44.631 9.626 4.636 3.70e-06 ***
## bs(age, knots = c(25, 40, 60))3 62.839 10.755 5.843 5.69e-09 ***
## bs(age, knots = c(25, 40, 60))4 55.991 10.706 5.230 1.81e-07 ***
## bs(age, knots = c(25, 40, 60))5 50.688 14.402 3.520 0.000439 ***
## bs(age, knots = c(25, 40, 60))6 16.606 19.126 0.868 0.385338
## ---
## Signif. codes: 0 '***' 0.001 '**' 0.01 '*' 0.05 '.' 0.1 ' ' 1
##
## Residual standard error: 39.92 on 2993 degrees of freedom
## Multiple R-squared: 0.08642, Adjusted R-squared: 0.08459
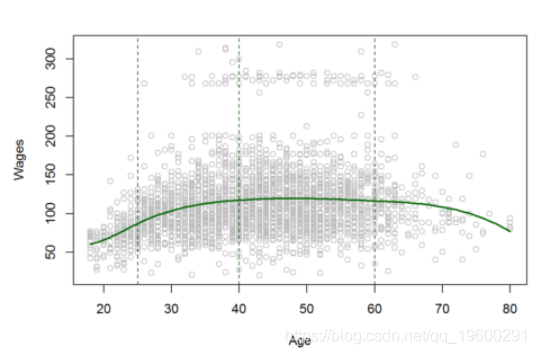
## F-statistic: 47.19 on 6 and 2993 DF, p-value: < 2.2e-16绘制回归线
![]()
上图显示了三次样条曲线的平滑和局部效果。
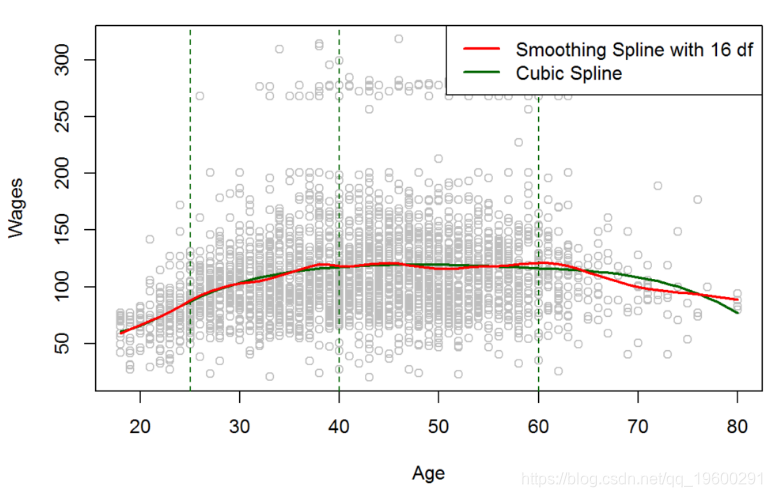
平滑样条线
我们在平滑样条曲线中的目的是通过添加粗糙度最小化误差函数 。
![]()
现在我们可以注意到,红线(即“平滑样条线”)更加摇摆不定,并且更灵活地拟合数据。这可能是由于高度的自由度所致。选择的价值,最好的办法 λ λ和DF是交叉验证。
实施交叉验证以选择λ值并实施平滑样条线:
fit2
## Call:
## smooth.spline(x = age, y = wage, cv = TRUE)
##
## Smoothing Parameter  spar= 0.6988943  lambda= 0.02792303 (12 iterations)
## Equivalent Degrees of Freedom (Df): 6.794596
## Penalized Criterion: 75215.9
## PRESS: 1593.383
#It selects $lambda=0.0279$ and df = 6.794596 as it is a Heuristic and can take various 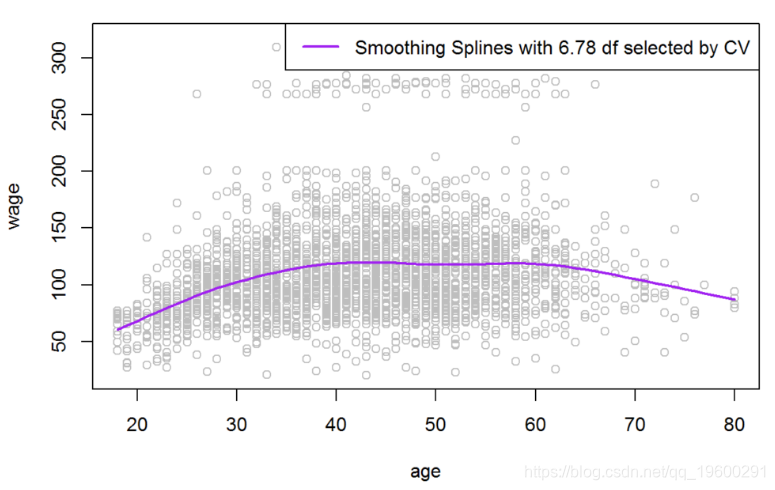
![]()
该模型也非常平滑,可以很好地拟合数据。
结论
因此, 我们需要对数据或变量进行一些转换,以使模型在学习输入X i Xi和输出 Y之间的非线性相互作用时更灵活,更强大。
![]()