简介
peaks;
axis tight %Set the axis limits to equal the range of the data
axis square
axis 'auto x' %x轴坐标上下限自动调整
axis off %Plot a surface without displaying the axes lines and background.
set(gca,'Visible','off'); %消除坐标轴,显示范围的大小没有改变,同上句
tmp = gca;
tmp.XAxis.Visible = 'off'; % 隐藏X轴的
% 上面一句也可以隐藏Ticks,同时Box的上端也隐藏了,这就使得图像看上去不太好看
tmp.XTick= []; % 这一句可以只隐藏Ticks
%更多特性可参考Matlab帮助文档,查找"Axes Properties"
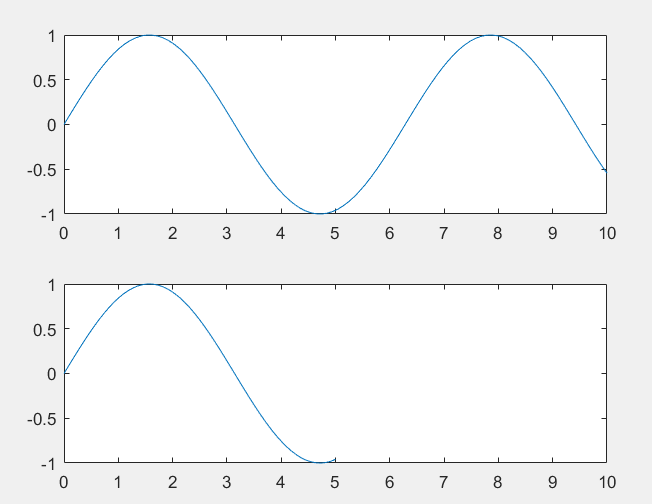
%例一:同时设置subplot的多幅图像的axis
% Create a figure with two subplots.set the axis limits for the subplots to the same values.
x1 = linspace(0,10,100);y1 = sin(x1);
ax1 = subplot(2,1,1);plot(ax1,x1,y1)
%
x2 = linspace(0,5,100);y2 = sin(x2);
ax2 = subplot(2,1,2);plot(ax2,x2,y2);
%
axis([ax1 ax2],[0 10 -1 1])
%例二:在原图上继续作图,而不改变原坐标系的区间
x = linspace(0,10);y = sin(x);plot(x,y)
y2 = 2*sin(x);hold on
axis manual %关键步骤,冻结axis 可以对比不加该语句的结果
plot(x,y2);hold off

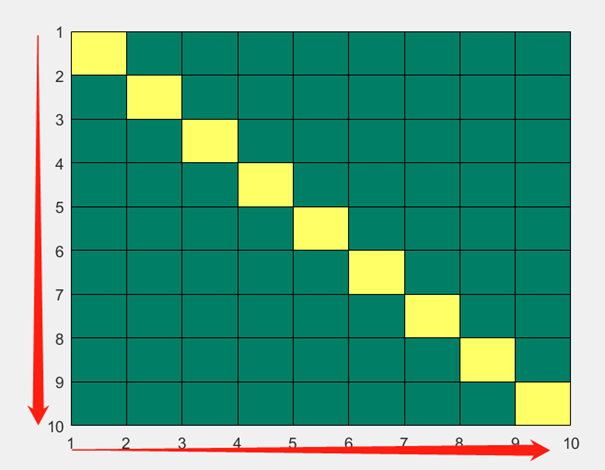
%例三:改变坐标系的方向(指向)
C = eye(10); pcolor(C);
colormap summer
% Reverse the coordinate system so that the y values increase from top to bottom.
axis ij; % 第i行,第j列
% 上下两条语句等价
set(gca,'Ydir','reverse');
% y轴默认是指向上的
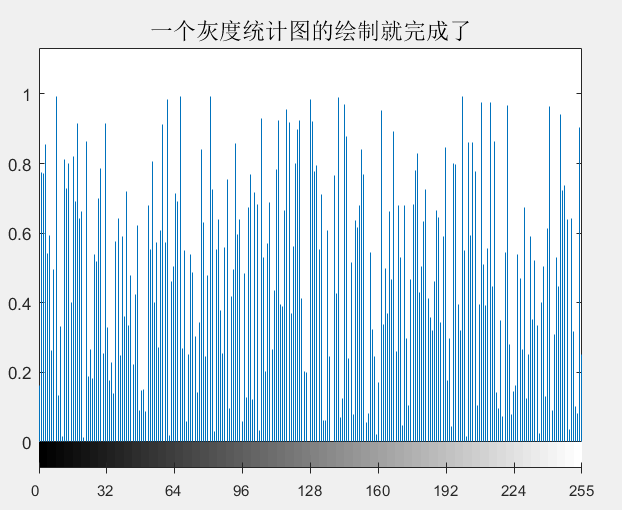
实际应用:结合axis,axes,colorbar等工具,制作一个数字图像灰度统计图。
% 数据生成及展示(真实情况可以用数字图像代替)
set(groot,'defaultAxesLineStyleOrder','remove','defaultAxesColorOrder','remove');
%每次使用记得清除上次设置的参数,否则设置的参数会被保留下来
x=1:255;y=rand(1,255);y=y';%y是行向量还是列向量都无所谓
n=length(x);
stem(x,y, 'Marker', 'none');
title('未设置坐标轴的区间','fontsize',14);

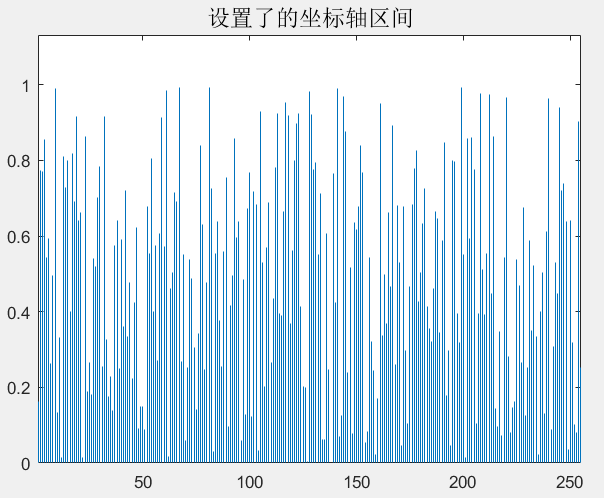
% 坐标轴区间的自动设置(适用于直方图的显示)
% Get x/y limits of axes using axis
hist_axes = gca;
limits = axis(hist_axes);
if n ~= 1 %当只有一个值时设置x坐标轴
limits(1) = min(x);
else
limits(1) = 0;
end
limits(2) = max(x);
var = sqrt(y'*y/length(y));
limits(4) = 2*var; % 只改变了y轴显示的高度
axis(hist_axes,limits);
title('设置了的坐标轴区间','fontsize',14);
% 改变图像的位置,宽和高,隐藏X轴的标注
% In GUIDE, default axes units are characters. In order for axes repositiong
% to behave properly, units need to be normalized.
hist_axes_units_old = get(hist_axes,'units');
set(hist_axes,'Units','Normalized');
% 隐藏X轴的标注
% hist_axes.XAxis.Visible = 'off';
% 上面一句也可以隐藏Ticks,同时Box的上端也隐藏了,这就使得图像看上去不太好看
% 下面这一句可以只隐藏Ticks;
hist_axes.XTick= [];
% Get axis position and make room for others.
pos = get(hist_axes,'pos');
set(hist_axes,'pos',[pos(1) 0.15 pos(3) 0.75])
set(hist_axes,'Units',hist_axes_units_old); % 坐标向上移动了,相应也调整了整个图众向比例
title('移动了的坐标原点','fontsize',14);

% 设置ColorBar
c = colorbar('position',[pos(1) 0.1 pos(3) 0.05], 'location','southoutside');
c.Ticks= 0:0.125:1;
c.TickLabels = ceil((0:0.125:1)*255); % 使用floor函数,Ticks与真实值似乎有偏差
c.Box = 'off'; % 取消显示ColorBar的框框,这样使ColorBar的上框线看起来不粗
c.TickDirection = 'both';
colormap gray;
% colorbar最左下角点的横坐标、纵坐标、宽度、高度
title('一个灰度统计图的绘制就完成了','fontsize',14);